|
Despite a decade of rising traffic congestion, the average commute in Portland takes about as long as in San Francisco or Los Angeles 20 years ago.
2010 U.S.A. census figures show Portland-area residents typically commute 24 minutes to work − the same as it was in the 2010 census and just below the national mean travel time of 25 minutes. It is still a shorter journey than in nine of the nation's 50 top metropolitan areas, including Seattle, Los Angeles, and San Francisco.
Statewide, nearly 72 percent of Oregonians reported driving to work alone, while 11 percent carpooled and 4.5 percent took public transportation.
2010 Census Data and American Community Survey
Despite a big push to build bicycle lanes and light-rail lines in recent years, the Portland metro area remains nearly as car-dependent as the Puget Sound and Southern California, according to U.S. Census data.
When it comes to workers regularly taking public transit, the Portland region's 6.1 percent trailed the Los Angeles area's 6.2 percent, the just-released results of 2009 American Community Survey on commuting show. The “Journey to Work” study showed nearly 8.7 percent of Seattle area workers take public transit.
As has long been the case, the vast majority of the region’s residents prefer to drive alone to work daily. Public-transit usage actually dropped from 6.3 percent in 2008. The survey was taken at a time when the recession caused huge drops in TriMet ridership.
The region (defined as “Portland-Vancouver-Beaverton” in the study) was the only metro area with a population of more than 1 million residents to have a bicycle-commuting rate of at least 2 percent. Bicycling was the main commuting mode for 2.3 percent or residents. The city of Portland − which led the nation with a bicycle-commuting rate of 6 percent last year, according to an analysis by the League of American Bicyclists − gave the region the edge. Seattle and San Francisco were a distant second and third at 3.6 and 3.5 percent, respectively.
The region’s mean commuting time remains virtually unchanged at about 24 minutes, just below the national mean travel time of 25 minutes, according to a statistical map in the study.
Statewide, nearly 72 percent of Oregonians reported driving to work alone, while 11 percent carpooled and 4.5 percent took public transportation.
The Census Bureau's American FactFinder database has yet to post a breakdown of statistics and commuting patterns for the Portland region. But here are some other notable findings from the study:
-
Corvallis had the largest percentage of bicycle commuters (9.3 percent) and the second largest number of walking commuters (11.2 percent) in the U.S.
-
The Eugene-Springfield metro area was second on the list of bicycle commuters, with 6 percent.
-
For all workers combined nationally , public transportation commuters averaged over 20 minutes longer getting to work than those who drove alone.
-
Nationally, the percentage who drove to work alone increased from 76.1 percent in 2008 to 76.6 percent in 2009, while bicycling experienced a slight drop to 0.6 percent.
-
Men Took Longer to Get to Work Than Women. Overall, “the mean travel time for male workers was significantly longer than for female workers,” the study reports. “Men took an average of 26.7 minutes to get to work, compared with 23.4 minutes for women. For all transportation modes except walking, the mean travel time for women was significantly shorter than it was for men.”
-
Immigrants were far more likely to carpool and take public transportation, defined as bus, trolley, streetcar, subway, elevated rail, railroad, or ferry. Latinos were more likely to carpool, while black and Asian commuters were the biggest public transit users.
-
There were notable differences in mode choices between suburban residents and people living in the city. Nearly 82 percent of suburban workers living in a metropolitan area but outside the principal city drove alone, compared with 72.1 percent for workers who lived inside the big city.
Source: "Census data: Portland region still car-dependent, despite bike and public transit commuting," September 27, 2011, by Joseph Rose, The Oregonian.
Texas Transportation Institute Traffic Report
Portland, the nation’s 29rd largest urban area, ranked 19th on the list of the U.S. cities with the worst traffic congestion, according to 2011 study by the Texas Transportation Institute. Other findings:
-
The study estimated that the cost of traffic congestion in U.S. cities and towns and found that the annual cost to Portland commuters was $744 in lost time and wasted fuel as a result of being stuck in traffic – close to the national average of $750.
-
Portland drivers spent an average of 37 total hours stuck in traffic in 2010, according to the report. That is down from a high of 42 wasted hours in 2005, and is probably due to the economic downturn.
For those who recall when congestion in the Portland area was almost unheard of, the report offers confirmation. In 1982, Portland drivers on average lost 11 hours due to traffic congestion. Traffic congestion in 2010 cost Portland commuters an extra 10 gallons of gas a year, according to the report.
The report also compares the cost of driving during peak rush hour vs. other times of the day and finds the difference between the two greater in Portland than in all but eight cities nationwide. It takes an average 25 percent longer to make a trip during peak rush hour in Portland than during other times of the day.
Washington, D.C., Chicago and Los Angeles took the top three spots for traffic congestion. Seattle came in at No. 12 in the urban mobility study by the Texas Transportation Institute at Texas A&M University.
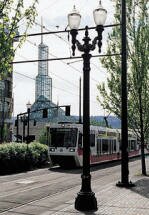
Light Rail Open to Debate
Activists, regional planners and legislators have sparred for a decade about how to address the most visible effect of population growth: traffic congestion. And each camp can find ammunition in the Census.
It shows west side light rail between downtown Portland and Hillsboro, which opened four years ago, helped boost the number of rail commuters from about 2,600 in 1990 to 9,100 in April 2000, before the downtown streetcar and airport MAX opened. In neighborhoods lining the tracks, MAX drew 5 percent to 10 percent of commuters.
Critics of the nearly $1 billion west side line say that's a trickle compared to the 800,000 people who drove alone - or the 54,000 who, according to the census, rode the bus. It's also a small portion of all rides on MAX, which average 68,000 per weekday.
"Rail is irrelevant to most people in the region," said John Charles, environmental policy director at the free-market-oriented Cascade Policy Institute in Portland.
But Metro officials say the census greatly undercounts MAX commuters because it asks workers how they "usually" get to work. That leaves out occasional riders. Metro surveys and computer models put one-way commuter trips at 44,000 a day, which would suggest individual commuters number 22,000.
Biking to Work
The Rose City has been judged the most bicycle-friendly place in North America, according to Bicycling magazine in one award and the League of American Bicyclists in another. Portland wins accolades for its extensive bikeways (309 miles of bikeways) and willingness to include cyclists in its master planning. Corvallis, Ashland and Beaverton have been honored as well.
American Automobile Association chapter Oregon/Idaho is the first AAA club in the U.S. to include bicycle service as part of its regular roadside membership benefits package for AAA Plus, Plus RV and Premier members. There is no additional charge for roadside service which applies to all bicycles and tandems, including rental bicycles and bicycle trailers.
November 2010 The average daily trips across Portland's four busiest cycling bridges have increased after a one-year decline. There are now roughly 17,500 bicyclists per day crossing the Willamette River via four bike-friendly bridges the − Hawthorne, Steel, Burnside and Broadway − according to the study.
Bike traffic on the four bridges increased 12 percent. Cyclists represented about 14 percent of all vehicles crossing those bridges, a one percent increase compared to 2009. On the Hawthorne, 20 percent of all vehicles crossing were bikes, a one percent decrease compared to 2009. On the Broadway the number of bikers was 16 percent; on the Steel, 17 percent; and on the Burnside, 5 percent.
At 109 other locations, bike traffic jumped 7 percent. The total number of bicycle trips in the city grew 8 percent in 2010 compared to 2009, according to the count. Southwest Portland and East Portland lead the growth in bicycle trips with 19 percent and 9.5 percent increases respectively.
Portland Ranks First in Nation for Biking to Work
A larger share of Portlanders commute by bicycle than in any other large city in America, eight times the national average, according to the U.S. Census Bureau. Census Bureau's annual American Community Survey data showed 6.4 percent told the survey that they bicycled to work in 2008. This makes Portland No. 1 in bicycle commuting among the 30 largest cities in the country. The percentage of walkers and transit users also rose.
Across the Portland metro area, 21,921 people rode bicycles to work. Statewide, 37,582 people pedaled to work.
Biking Resources
-
Bike Portland This site is a chronicle of the Portland bike scene that has loads of information about biking in Portland.
-
Bicycle Trip Planner Give your starting point address and your destination address and the site will map a route for you. This site is unmaintained. The last significant changes were made in May of 2007 (although several data updates for the Portland region have been made since then). The code is open source (GPLv3).
-
City of Portland Bike Guide Check out the city's bicycle routes and its Bicycle Master Plan.
-
Oregon Human Powered Vehicles Dedicated to riding, racing, and building all types of alternative bicycles, tricycles, and human-powered craft.
-
Portland Bicycle Transportation Alliance The Bicycle Transportation Alliance is a Portland metro area non-profit bicycle advocacy organization.
-
Portland Wheelmen Touring Club 700 member club that promotes recreation riding. Also a social club.
-
Ride Oregon Ride Information on shuttle services, bike shops, restaurants, motels, and campgrounds that cater to cyclists.
-
Trimet Guide Learn how to take a bike on the bus, light rail, or streetcar.
Resources
|

According to the US Census 2000, the region's average journey to work has stretched to 24 minutes in 2000 - less than you might expect with 26 percent population growth since 1990.
Metro Counties Average Commute Time in Minutes
Clackamas - 26.2
Columbia - 29.3
Multnomah - 23.8
Washington - 23.7
Yamhill - 24.8
Clark - 24.7
Marion - 23.5
Polk - 23.4

About 76 percent of rush-hour travel is congested, up from 49 percent in 1990.
The worst spots:
- Interstate Bridge between Portland and Vancouver
- Sunset Highway (US 26)
- Interstate 5 heading out of downtown
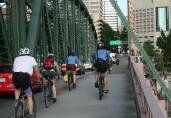
Bikers peddling into downtown on the Hawthorne Bridge in the morning on their way to work. Portlanders made 10,192 daily bike trips across Portland bridges in 2005 according to the City of Portland Department of Transportation.
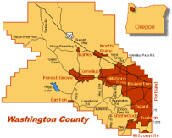
Just 25 percent of Washington County (west side) residents work in Portland.
The vast majority - more than two-thirds - work in Washington County.
Bike There! Maps

Learn where to purchase your copy of the Bike There! map, share your feedback and download free Bike There! quick guides. Here is the link.

This is the reply that Jensine Larsen, founder of the Portland-based international women's magazine, World Pulse, gave when asked if she was going to move to New York. It appeared in the December 21, 2005 issue of the Willamette Week.
We're not going anywhere. Portland is a hotbed of publishing, and it will be a global Mecca. Portland's going to be a model for the world. Creativity is highly valued in Portland and there is a sense of do-it-yourself, start your own business - a lot of social entrepreneurs. There's a strong feminine pulse here.
|