|
|
Geography
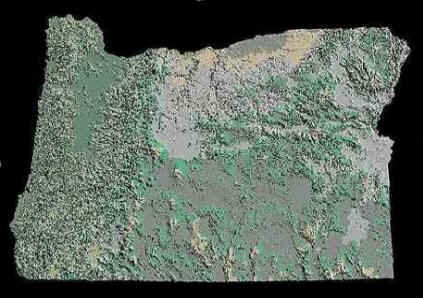
Oregon is a state divided by mountains. The Cascade Mountains stretch across the entire north/south length of Oregon, producing areas with two entirely different climates. West of the Cascades, a mild, moist marine climate prevails, while east of the Cascades, Oregon's high desert country can be scorching hot or bitterly cold. In between the Cascades and the coast, the Coast Range defines the lush growing land of the Willamette Valley from the marine coast area.
Oregon Physical Dimensions:
-
Oregon is the 10th largest state with 96,002 square miles.
-
The state's water area covers 1,129 square mile.
-
Oregon is located half way between the equator and the north pole.
-
The coastline is about 360 miles in length and it's all public land.
-
The Columbia River covers approximately two-thirds of the northern border of the state.
-
The Snake River covers about one-half of the eastern border of the state.
-
The Pacific Ocean is the state's western border.
-
Portland latitude is 45° 31' N and the longitude is 122° 41' W (9 a.m.). For a reference point, the northern most place in the "lower 48" is the Northwest Angle in Lake of the Woods, Minnesota (49° 4' N). Quebec's latitude is 46° 49' N which is very similar to Portland so we both receive about the same amount of daylight hours in the summers and darkness in the winters.
Climate
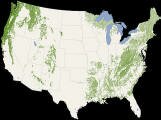
So how much does it rain in Oregon? On the coastal mountain range the average rainfall in certain areas is 120 plus inches. In the far eastern section of the state, 6-8 inches of annual rainfall is normal. The Oregon Department of Forestry Rainfall map is a good presentation of the Oregon rainfall.
Four Factors Affecting Temperatures The year-around pattern of temperature across Oregon reflects the influence of four major factors:
-
The seasonal cycle of solar radiation.
-
The Cascade Range, which forms a barrier that generally confines mild Pacific air masses west of the crest and cold continental polar air masses to the east.
-
The moderating influence of the Pacific Ocean.
-
Elevation in general, with upland areas being colder than lowland areas.
 The Weather Café™ by Rufus provides uniquely informative long-range forecasts for specific patrons in the Pacific Northwest. Rufus' forecasts have information of value, but even more, they show a sense of humor and are fun to read. It is a free service for patrons from British Columbia to northern California. The Weather Café™ by Rufus provides uniquely informative long-range forecasts for specific patrons in the Pacific Northwest. Rufus' forecasts have information of value, but even more, they show a sense of humor and are fun to read. It is a free service for patrons from British Columbia to northern California.
Oregon Climate Service is an outstanding site for Oregonians interested in weather. Maintained on the Oregon State University campus, they have everything from satellite images to historical records of Oregon weather. They have built many links to other weather sites.
Record Rainfall In Gold Beach (Curry County on the coast), 15.32 inches fell between January 16, 1953 and January 19, 1953. In the floods of February 1996, 27.55 inches fell February 5-9 on Laurel Mountain in the Coast Range west of Salem. Laurel Mountain holds the record of the most rainfall in any year in Oregon: 204.34 inches in 1996. Oregon single-month rainfall record remains with the Glenora weather station (the station closed in 1918) in the mountains near Tillamook. In November 1909, 57 inches fell. These facts were obtained from The Oregon Weather Book by George Taylor and Raymond R. Hatton, Oregon State University Press, ISBN 0-87071-467-8. The wettest day in Oregon history occurred on November 6, 2006 when 14.30 inches of rain fell at Lees Camp near the Wilson River.
Bright Spots in the Northwest Rain Shadows Locals call the rain shadow on the Olympic Peninsula at Sequim, Washington, the "Blue Hole" because there are often blue skies there surrounded by clouds, fog, and rain. Sequim, located along the Strait of Juan de Fuca, averages 18 inches of rain each year. Just to the southwest in the Olympic Mountains, rainfall averages 240 inches per year (20 feet).
According to the book, Weather Extremes of the West, the rain shadow created by the Cascade mountains that blankets the eastern two-third of Oregon results in a similar phenomenon. The most sudden change in precipitation occurs from Santiam Pass on U.S. 20 to the town of Sisters. In 20 miles, precipitation drops from 90 inches a year to just 14 inches. The elevation change − Santiam Pass is at 4,817 feet and Sister is at 3,186 feet − means that for each foot in elevation, precipitation drops .05 inches.
 Snowpack The mountain snowpack is just as important to Oregon's economic health as the winter rains in the valley. Snow hydrologists say that three-quarters of our water supply comes from snowmelt. The melting snow feeds rivers and lakes in the summer and fall. This provides the water for agriculture crops and power. Snowpack is what keeps the reservoirs full - the source of water for residents. Snowpack is also important to anglers and conservationists. Ever winter, a snow hydrologist straps on snowshoes and packs a 12 1/2 foot aluminum tube up to the mountains in Oregon. They measures snowpack which is a combination of snow depth and moisture content. What they hope to find is water content of the snowpack above 100 percent of normal. For example during the winter drought of 2000-2001, the moisture content measured at 79 percent of normal. In the winter of 2007-2008, the water content was over 150 percent of normal in the mountains. Snowpack The mountain snowpack is just as important to Oregon's economic health as the winter rains in the valley. Snow hydrologists say that three-quarters of our water supply comes from snowmelt. The melting snow feeds rivers and lakes in the summer and fall. This provides the water for agriculture crops and power. Snowpack is what keeps the reservoirs full - the source of water for residents. Snowpack is also important to anglers and conservationists. Ever winter, a snow hydrologist straps on snowshoes and packs a 12 1/2 foot aluminum tube up to the mountains in Oregon. They measures snowpack which is a combination of snow depth and moisture content. What they hope to find is water content of the snowpack above 100 percent of normal. For example during the winter drought of 2000-2001, the moisture content measured at 79 percent of normal. In the winter of 2007-2008, the water content was over 150 percent of normal in the mountains.
Studded Tires Allowed in Oregon Many states ban the use of studded tires but not Oregon. Studded tires are legal in Oregon from November 1 through March 31 − drivers caught using studded tires outside of these dates face a $190 fine. The state spends about $11 million per year fixing studded tire damage on roads and bridges. Tire studs cause about $40 million per year in damage, according to the Oregon Department of Transportation. According to a study published in 1996, roadways fail in seven or eight years where studs are in use. Without studs, the roads would last 10 to 20 years. In Oregon, efforts to ban or regulate studs have failed.
Water Usage
In a state where rain rules, access to water is increasingly contested as it is in most Western states. Oregon estimates that in the coming years, demand will grow by 1.2 million acre-feet; we use about 9 million acre-feet now. Water is measured in acre-feet − the amount that covers an acre to a depth of 1 foot − and gallons. An acre-foot equals 326,000 gallons. Oregonians use about 70 million gallons a day to drink, bathe and cook. Portland uses 136 gallons a day per person.
Every product made in the state, from canned peaches to silicon wafers, takes water. The state lights up on power generated thanks to water. And now fish have arrived as a demanding customer. Powerful interests from federal judges to national environmental groups insist that more water be left in rivers for fish. That means less water for some at a time when people are demanding more.
 Agriculture uses 85 percent of the state's water, measured in acre-feet this amounts to 7.8 million. Industrial uses 534,000, domestic wells 80,000, and municipal systems 539,000. Travel along I-84 in eastern Oregon during the summer months and you can see irrigation rig after irrigation rig spraying water over the crops. Agriculture uses 85 percent of the state's water, measured in acre-feet this amounts to 7.8 million. Industrial uses 534,000, domestic wells 80,000, and municipal systems 539,000. Travel along I-84 in eastern Oregon during the summer months and you can see irrigation rig after irrigation rig spraying water over the crops.
The Umatilla Basin, stretching from the river plateaus at Boardman east to the rolling hills around Pendleton, provides some of the country's most productive cropland. Sediment deposits over left a soil suitable for many crops and all that is needed is water. And they have taken it to cultivate more than 200,000 acres with water drawn from the Columbia River and tributaries or from wells tapping the deep water trapped in layers of basalt. The agriculture industry in the area devised the pivot irrigation system that spits out water in carefully measured doses. Farmers in the Umatilla Basin are considered among the most water-efficient on the planet.
In the Umatilla Basin, farmers can grow about $150 worth of wheat on an acre of dry ground. If they can get an extra foot or two of irrigation water, they can switch to peas or potatoes worth up to $3,500 an acre. Multiplied over thousands of acres in the basin, water can boost farm sales by millions.
Klamath County remains a poster child for what happens in modern water wars. The fight between fish and farmers got national attention, prompting intervention by then-Vice President Dick Cheney. For safety, federal scientists removed government plates from their vehicles before driving into the Klamath Basin. The farmers won that battle but came out the villains when salmon by the thousands died in the summer due to low water in the Klamath River.
Whoever controls the limited supply will control new housing and industry and how farming expands. There's not much to divvy up. In summer, every gallon of water in every stream is already claimed.
High Cascades Contains an Immense Reservoir of Water
 Scientists from the U.S. Forest Service and Oregon State University have in recent years realized that the high Cascades in Oregon and far Northern California contain an immense subterranean reservoir about as large as the biggest man-made reservoirs in the country. The stockpile stores close to seven years' worth of Oregon rain and snow and is likely to become increasingly precious, even priceless, as population and climate add pressure to water supplies. Scientists from the U.S. Forest Service and Oregon State University have in recent years realized that the high Cascades in Oregon and far Northern California contain an immense subterranean reservoir about as large as the biggest man-made reservoirs in the country. The stockpile stores close to seven years' worth of Oregon rain and snow and is likely to become increasingly precious, even priceless, as population and climate add pressure to water supplies.
The reservoir hides within young volcanic rock − less than one million years old − in the highest reaches of the Cascades. The rock is full of cracks and fissures it forms a vast geological sponge. Heavy rain and snow falling on the rock percolate into the sponge, like a river filling a reservoir. The high amount of rain in Oregon and the unique geology permits the retention of much of the water.
According to researchers at the Pacific Northwest Research Station, it's one of the biggest groundwater systems known in a mountainous region anywhere on the planet.
Some water leaks steadily from the hidden reservoir, gushing from springs into rivers such as the McKenzie, Deschutes and Clackamas. Many of the rivers flow into the Willamette, keeping the river through Portland full of water in the dry months of the summer, when mountain snow that feeds many other Western rivers is long gone and the rivers are just trickles.
That all-year reliability of water from the underground store puts Oregon in a much stronger position than the rest of the West as global warming dries out nearby states, some already suffering through record drought. At the same time, it may also make the Northwest a sought-after source of future water for the rest of the West. Southwest states have already floated the far-out idea of piping in water from the Columbia River. Businesses such as technology companies that require reliable water supplies for manufacturing may see the consistency of Oregon's enormous reservoir as a strategic advantage. Some experts think that the value of water coming out of this system absolutely exceeds any other economic value from national forestlands.
When Grant and his team began studying the water system, they found its water spilling from large springs so little-known they don't appear on maps. One spring pours out a full one percent of the summer volume of the Willamette River − some 43 million gallons a day, enough to supply almost half of Portland's year-round water needs.
Huge Springs Discovered
Gordon Grant, a research hydrologist at the U.S. Forest Service's Pacific Northwest Research Station is leading the research. When Grant and his team began studying the water system, they found its water spilling from large springs so little-known they don't appear on maps. One spring pours out a full one (1) percent of the summer volume of the Willamette River some 43 million gallons a day, enough to supply almost half of Portland's year-round water needs. Grant isn't highlighting its location. "You can be sure the bottled water people would like to know all about it," he said.
He and his colleagues are also studying the way global warming may influence the underground water supply. Many climate models show that as temperatures rise, more winter snow will fall as rain instead and run off the landscape more quickly. Less snow will remain to melt and feed rivers in summer, when water is needed most.
The underground Cascade reservoir changes the picture in the rivers its springs supply. Water entering the reservoir as rain or melting snow pushes water out of the springs, so as less water flows in from melting snow in the summer, less will exit the springs, Grant says.
However, because so much water remains underground, plenty is left to flow out during the summer. That means rivers fed by the reservoir's springs − though reduced somewhat by climate change − will keep flowing far more reliably than rivers fed by snowmelt alone.
Resources
Source: The secret's out: Tons of water in Oregon's Cascades by Michael Milstein, The Oregonian October 19, 2008.
Plants, Trees, and Flowers of Oregon
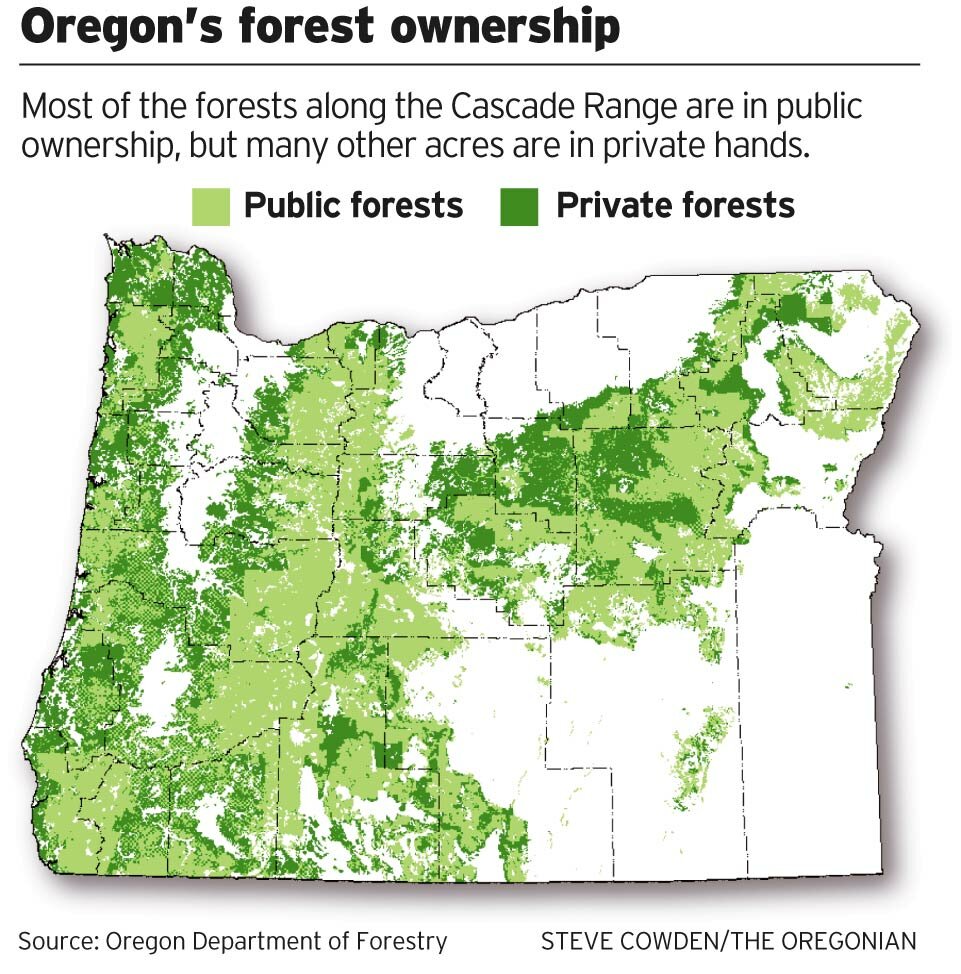
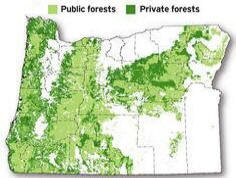
The forests of Oregon are strongly identified with the state. Sixty percent of Oregon's forests are publicly owned. West of the Cascades, Douglas fir is the primary conifer species, with Sitka spruce and western hemlock found mainly on the coast. East of the Cascades, the main species is Ponderosa pine. Other eastern Oregon trees are larch, lodgepole pine and western juniper. Broadleaf trees include big leaf maple, Oregon white oak and madrone. Pungent smelling myrtlewood grows in southern Oregon.
The wildflowers of Oregon are a special treat for the visitor. Driving, biking or especially hiking anywhere in Oregon can lead you by a myriad of wildflowers, both large and small. The vivid blue of delphiniums, the quirky petals of an inside-out flower, a bright splash of Indian paintbrush or the breathtaking view of a field of glacier lilies - all these and much more can be seen in Oregon.
Forests
 Since the 60s, loggers and environment groups have fought each other in the courts as well as in the woods. But that may be changing as both groups are starting to work together. Since the 60s, loggers and environment groups have fought each other in the courts as well as in the woods. But that may be changing as both groups are starting to work together.
The financial argument for maintaining forests has steadily weakened for years, as wood that grows quickly in places like Brazil filled the world market and pushed timber prices down. That's good for consumers, but not for forest owners hoping to profit from long-term forestry.
Thousands of acres of forestland are lost in the United States each year. So far, Oregon has not seen as much loss as many other states. Trees grow so well in Oregon it often makes more financial sense to hold onto the land. Because Oregon's land use controls make real estate development less lucrative and because trees grow well on the wetter west side of the state, forestland loss has been minimal in western Oregon. The picture is different in northeast Oregon, though. Trees grow more slowly and sawmills have shut down, so it's more difficult to make logging pay. There, selling forestland generates more revenue as holding it over the long term.
In the recession of 2008-2009, you may think that environmental groups would be glad timber prices have collapsed to where loggers' chain saws have fallen silent and sawmills are shutting down. Instead, they're nervous. If logging doesn't pay, the same timber companies some environmentalists have blamed for ruining the forest may get rid of the forest − selling off their prime real estate. Then subdivisions could grow instead of trees, absent the wildlife, clean water and other benefits forests typically present. The solution is to work with large forestland owners to help them profit from their forests so they do not sell the land off.
You'll frequently hear the term "old growth" used when Oregonians talk about trees. What does it mean? In a tree, picking the "old growth" age is debatable. Some claim it begins at 80 years old; most agree that any centuries-old pine or fir qualifies. In a forest, it means the presence of older giants, as defined above, interspersed with younger trees as part of a complex ecosystem.
Tallest Forests in the World
 Nowhere on Earth can you find forests as tall and vast as those in the Pacific Northwest. They make Canada's great boreal forests look like shrubs. Amazon rain forest trees are mere halflings by comparison. Nowhere on Earth can you find forests as tall and vast as those in the Pacific Northwest. They make Canada's great boreal forests look like shrubs. Amazon rain forest trees are mere halflings by comparison.
Michael Lefsky, a former Oregon State University scientist now at Colorado State University, devised a way to combine millions of observations from NASA satellites to map tree heights around the planet. We now have the first global-scale map charting the heights of the world's forests. The mapping effort gives scientists an important tool to track how the world's forests draw in carbon dioxide and influence the rate of global warming. While the first map is a rough draft, it shows the potential for making accurate global measurements of forest growth.
Only a tiny fraction of the earth's land mass gives rise to tall forests. In northern California, small patches of coast redwoods exceed 200 feet and from British Columbia to Oregon, rain-drenched stands of Douglas fir and Sitka spruce routinely reach 130 feet or more. Forests along the southern rim of the Himalayas come close, as do forests in Laos, Malaysia and Indonesia. In the Amazon, average heights of forest stands seldom exceed 70 feet. In the huge tracts of boreal forest across North America and Eurasia, trees are lucky to reach 50 feet.
To make the map, Lefsky used a satellite-based lidar instrument, which bounces laser flashes off the Earth. He calculated tree height from measurements of how much longer it took flashes to bounce back from the ground than from the tops of trees. Lefsky analyzed more than 250 million such observations recorded over seven years, which gave him lidar measurements of only 2.4 percent of the Earth's forested surface. To complete the map, Lefsky combined the data with imaging from two other NASA satellites.
Mapping forest height at a planetary scale could make it easier to track how much carbon forests store. Accounting for the fate of global carbon dioxide emissions remains a challenging problem. Forests take up some of the carbon dioxide from burning fossil fuels, but it's not clear how much.
We humans release about 7 billion tons of carbon to the atmosphere each year. About 3 billion tons of these emissions remain in the atmosphere and 2 billion tons make their way into the oceans. The rest, presumably, is taken up by vegetation, including forests. But scientists can only account for a fraction of the carbon forests are supposed to be storing.
Source: "Towering northwest forests stand out in global map," The Oregonian July 23, 2010. Author Jose Rojas-Burke.
Animals and Birds
 The wildlife of Oregon is diverse. Oregon has herds of Roosevelt elk and black-tailed deer in the western part of the state, and Rocky Mountain elk and mule deer east of the Cascades. In the high desert country of southeastern Oregon, there is a refuge for pronghorn antelope. Smaller animals in Oregon include skunks, raccoons, chipmunks, squirrels and opossums. Mountain lions, black bears and bobcats are also found in Oregon's forests. The wildlife of Oregon is diverse. Oregon has herds of Roosevelt elk and black-tailed deer in the western part of the state, and Rocky Mountain elk and mule deer east of the Cascades. In the high desert country of southeastern Oregon, there is a refuge for pronghorn antelope. Smaller animals in Oregon include skunks, raccoons, chipmunks, squirrels and opossums. Mountain lions, black bears and bobcats are also found in Oregon's forests.
As part of the Pacific Flyway, Oregon has many species of birds. The Klamath basin hosts the largest number of year-around bald eagles in the lower 48 states, and is known as Oregon's premier bird watching area. Some of the species that can be seen are golden eagle red-tailed and rough-legged hawks, Canada geese, many duck species, herons, gulls, terns and grebes. Wildlife preserves such as Malheur and Findley are stopover points for Canada and snow geese, whistling swans, and the rare Sandhill Crane.
Willamette Stone
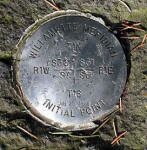 The Willamette Stone is one of 37 principal meridians in the United States. The stone − which marks the intersection of the Willamette Meridian, running north to the Puget Sound and south to California, and the Willamette Baseline, running east to Idaho and west to the Pacific Ocean − established the grid that government surveyors used to measure land into six-mile squares, called townships, after the Donation Land Claim Act of 1850. The Willamette Stone is one of 37 principal meridians in the United States. The stone − which marks the intersection of the Willamette Meridian, running north to the Puget Sound and south to California, and the Willamette Baseline, running east to Idaho and west to the Pacific Ocean − established the grid that government surveyors used to measure land into six-mile squares, called townships, after the Donation Land Claim Act of 1850.
The markers began in the east and moved west as the population spread. The federal government chose the site for the Willamette Stone of the initial point and indicated it should be west of the "lake," which was Vancouver Lake, and south of the Columbia River.
If you own property in Oregon today, you'll see the words "Willamette Meridian" or the initials W.M. noted on the legal description of your land.
The original Willamette Stone obelisk was vandalized in 1951, 1967 and 1987. In 1988, a stainless steel monument several inches thick and designed to prevent vandalism was drilled into the Initial Point. The stone, which wasn't actually a stone at first but a stake, sits about 3 1/2 miles from downtown Portland in the West Hills off Skyline Boulevard. The pullout is on the left-hand side of the road soon after you turn onto Skyline from Burnside. It's an Oregon heritage site and, at 1.6 acres, one of the smallest of the state's parks.
Oregon Maps
We're a bit crazed by maps, and Oregon's physical features (i.e., mountains, high desert, ocean, river, lakes, and valleys) are ideally suited to be displayed on a map. So if you're interested, here are some sites to visit for Oregon maps. Please be patient as many of the maps require a substantial amount of time to display due to their complex graphical features.
-
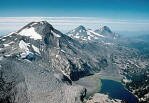
Oregon Blue Book Displays all the major rivers and mountain ranges. You'll get a good sense of the Oregon peaks in the Cascade Range.
-
Grant County They have relief maps, satellite maps, Oregon Trail maps, and a colorful map 1895 map of Grant County.
-
Microsoft Terraserver The Encarta Learning Center has maps of the world.
-
National Geographic National Geographic calls the site their Map Machine. Create a "dynamic" map of Oregon to see the state's physical features.
-
Oregon Department of Geology and Mineral Industries Using a laser-based terrain mapping system, they have produced giant color images of the Portland basin, Mount Hood and the Columbia River gorge.
-
Oregon Department of Transportation ODOT provides excellent traveling maps.
-
Oregon Historical Society The OHS Maps Collection contains over 30,000 maps, focusing on Western Exploration, the Oregon Territory, and the Pacific Northwest Region. Some of them are available online. To search, select the " Horizon Public Access Catalog" on the Collections page.
-
United State Geological Survey View the top 17 peaks in the Cascade Range from Washington to Northern California. Detailed explanations of the peak's features include volcanic, earthquakes, glaciers, mudflows, etc. Brought to you by the USGS Cascades Volcano Observatory.
|