Guide to the City of Beaverton, Oregon
 Beaverton is the fifth largest city in Oregon with a population of 89,803 (2010 US Census) and a land area of 18.73 square miles. Beaverton is located in Washington County which is one of the fastest developing areas in Oregon with a population of 529,710 in 2010 (the population was 445,342 in 2000). That represents an increase of 16% from 2000. Washington County grew 42.94% from 1990 to 2000.
If the more than 225,000 residents living within unincorporated areas of Washington County formed a city, it would rank second in the state, behind only Portland.
Two events in the 90s turned this sleepy suburb into a sprawling city:
- The development of a electronics industry – mainly chip plants.
- The building of the MAX light rail line through Beaverton.
In Beaverton, one-fourth of residents grew up without English and one-fifth are foreign-born. Beaverton defies everything we’ve been taught about suburbs and cities. It is more diverse, more dynamic and more densely populated (4,795 people per square mile vs. 4,375 people per square mile) than Portland, yet it doesn’t look at all like a city.
The Tualatin River and its drainage basin are almost entirely within the county, with the county nearly coterminous with the Tualatin Valley. It is bordered on the west and north by the Northern Oregon Coast Range, on the south by the Chehalem Mountains, and on the north and east by the Tualatin Mountains (or West Hills).
Money Magazine Names Beaverton as One of Best Places to Live
Money magazine picked Beaverton as one of the best places to live in the U.S. for 2016. Beaverton came in at number nine on Money’s list of the 50 best small cities in America. The list was put together using more than 60 factors including taxes, education, community amenities and accessibility to health care. The report notes property taxes are also about 85 percent of what are paid in Portland.
Downtown Beaverton
The area just west of Highway 217 along Canyon Road and the Beaverton-Hillsdale Highway was the heart of old downtown. Finding the original downtown is difficult, for blocks (more accurately miles) around the area, one-story retail outlets have sprung up. Car dealerships combined with numerous mini-malls has erased any sign of historic Beaverton. The Cedar Hills Mall (just north of old downtown) and the area around old downtown have melted together, so it is almost impossible to tell where one starts, and the other begins.
But for all the complaints about the landscape of the area, it attracts shoppers. Within a mile one can buy a new automobile, scout out the latest in electronics equipment, shop for the week’s supply of food, complete one’s wardrobe, and have lunch at any fast food outfit. Of course, you can also attend a movie and sip a latte.
History of Beaverton
The Tualatin Valley and Beaverton area were the home of native people who referred to themselves as “Atfalati”. Westerners later mispronounced the name as Tualatin. The tribe was a hunter-gatherer group which relied more on plants than animals for their food. In the spring of 1847, the first land claim (comprising 640 acres of beaver dam) located in what is now Beaverton was taken up by Lawrence Hall. Lawrence and his brother built a grist mill near present-day Walker Road.
Spurred on by a railroad into the town built in 1868, the small farming community west of Portland began to grow. By 1893 the City of Beaverton was formally incorporated with a population of 400. Originally named Twality when created in 1843, the territorial legislature renamed it for the first president of the United States, George Washington, in 1849. The original boundaries had included the entire northwest corner of Oregon before sections became new counties.
Beaverton May Grow to 300,000 Within Ten Years
 In December 2004, the City of Beaverton announced that they would annex the unincorporated neighborhoods of Cedar Hills, West Slope, Raleigh Hills and Garden Home over the next ten years. It also would add the Nike and Tektronix campuses and Providence St. Vincent Medical Center. After the first round of annexations, the city would add the Bethany and Cedar Mill areas and much of Aloha.
Using the current populations of those areas, Beaverton would add about 200,000 residents. The first round of annexations focuses mostly on areas already surrounded by the city. State law allows those annexations without landowner approval. The second round may require more input for landowners who currently are outside city limits and farther from current boundaries. Beaverton’s ultimate boundary would extend at least to Northwest Springville Road and the Multnomah County line to the north, the city of Portland to the east and the city of Tigard to the south. The boundary would follow the Beaverton School District line to the west.
One obstacle was the opposition of Nike, Inc,‘s World Headquarters. In a prepared statement, Nike officials said that they had taken legal steps to block the city from incorporating its headquarters. It expected that several other groups would begin mounting opposition to the annexation plans.
Those plans have since been put on hold after Beaverton attempted to forcibly annex Nike, which would have increased Nike’s taxes substantially. Nike successfully lobbied the legislature for a law that would prohibit their annexation for 99 years. Since that decision, annexation plans have been halted, and Washington County started urban planning to provide city-level services to the unincorporated areas in the county.
Beaverton Civic Plan
Over the past several years, more than 5,000 residents crafted the Beaverton Community Vision which emphasizes greater connectivity, economic opportunity, and environmental sustainability. The Beaverton Community Vision reflects goals and ideas shaped by the people of Beaverton, and without testing and prioritizing these ideas and developing a coordinated plan, the vision’s boldest ideas will remain concepts and “might-have-beens.”
The Civic Plan is the City’s commitment to making many of the aspirations of the Community Vision a reality and will unite the City behind an effort to achieve vision goals and priorities. Now is the time to assemble the resources, tools, and partnerships to bring that vision into action. This work will require many hands and won’t be done overnight. While the Community Vision set the roots, the Civic Plan will provide a framework to bear the fruits of your community vision
Beaverton is the Home of Nike
 Nike’s 750-acre campus is located in the heart of Beaverton where sports celebrities come and go frequently. Nike’s world headquarters are surrounded by the city of Beaverton but are within unincorporated Washington County. This makes for relatively cheap property taxes. The Nike campus has a full soccer field along with other facilities to include a gym and running track.
In the mid-90s, the city attempted to forcibly annex Nike’s headquarters, which led to a lawsuit by Nike, and lobbying by the company that ultimately ended in with a bill passed by the Oregon Legislature in 2005. Under that bill’s terms, Beaverton is specifically barred from forcibly annexing the land that Nike and Columbia Sportswear occupy in Washington County for 35 years.
Beaverton is also the home of Tektronics, a high tech firm and one of Oregon’s largest employers.
Tualatin Hills Park and Recreation District
Beyond the asphalt automobile lots of Canyon Road, miles of trails zigzag through forest groves and quiet parks. You won’t need a car here. Sixty miles of trails link Beaverton schools, recreation centers, playgrounds, restaurants and shops to nature. Hidden behind suburban strip malls, the paths curve around neighborhood streets, wetlands and dense blackberry thickets.
The Tualatin Hills Park and Recreation District encompassing Beaverton are the largest of its kind in the state of Oregon, serving 240,000 area residents. The district’s service area covers 50 square miles, and there are 95 park sites with active recreational amenities – including 70 miles of trails, eight swim centers, six recreation centers, and 1,500 acres of natural areas – scattered throughout its bounds. The district also includes a sports complex, a regional nature park, a tennis center, two historic sites, a senior center, skate park, roller hockey park, and two lakes. The district sponsors recreational and competitive league sports and special-interest classes.
Two “must see” trail destinations include the 219-acre Tualatin Hills Nature Park and historic Jenkins Estate on Cooper Mountain.
Beaverton Neighborhoods
It’s difficult to get your “arms around” Beaverton because it is numerous villages within a city. Currently, the City of Beaverton 11 recognized Neighborhood Association Committees (NACs). Participation in an NAC is open to anyone who lives, works, owns a business, or represents an institution or non-profit organization within the boundaries of the NAC.
For maps (PDF format) of the neighborhoods, visit Beaverton Neighborhood. Following are the neighborhoods web pages:
- Central Beaverton NAC
- Denney Whitford/Raleigh West NAC
- Five Oaks/Triple Creek NAC
- Greenway NAC
- Highland NAC
- Neighbors Southwest NAC
- Sexton Mountain NAC
- South Beaverton NAC
- Vose NAC
- West Beaverton NAC
- West Slope NAC
Community Demographics and Websites
- City of Beaverton 2010 US Census Demographics Profile of general demographics characteristics.
- City of Beaverton
- Beaverton Chamber of Commerce
- Beaverton Valley Times Weekly newspaper.
- Washington County Elections Division
- Washington County Intermap system is provided to assist visitors with retrieving property related information and documents without having to come to a county office. Information is currently available for tax lots, city boundaries, school districts, planning designations, service districts, aerial photos, property values, contour elevations and tax maps.
- Washington County Visitors Association Want more information about Washington County? Their Visitor Guide offers pages of highlights and ideas. You’ll find the guide on the homepage where you can download it.
Portland Monthly Magazine Guide to Neighborhoods & Communities
 In their April issue every year, the Portland Monthly Magazine features the past year home prices along with other information about Portland neighborhoods and suburban communities. To read the magazine’s latest stories and numbers visit the Real Estate section.
The numbers on the website and the printed magazine are divided into four sections (real estate, people, crime, and lifestyle) on each of the Portland 90 plus neighborhoods as well as about 25 suburban communities. The website offers over 50 items of information about each Portland neighborhood and suburban community.
The magazine added a feature on their website for homes sold in 2014 and it’s also available for homes sold in 2015 — an interactive map where you can click on a neighborhood and a pop-up displays five items (1-year median price change, 5-year median price change, median gross rent, walkability score and percent of newcomer) for a Portland neighborhood as well as a suburban community. Note the detailed numbers for each of the four sections for homes sold in 2015 are displayed below the map.
To visit the magazine’s website latest stories and numbers visit their Real Estate section — click on “Neighborhoods” to view the numbers for the Portland neighborhoods and click on “Suburbs” for the numbers on communities in the metro area. Note the detailed numbers for each of the four sections for homes sold in 2014 and 2015 are displayed below the map. To access the Portland neighborhoods and metro communities demographic data and home prices by year:
- 2013 Demographics and Home Prices
- 2014 Demographics and Home Prices
- 2015 Demographics and Home Prices
Beaverton Demographics Below is some facts about the Beaverton community gleaned from the magazine’s website. A few numbers can tell much about the character of a community. You can view more data about Beaverton by visiting the Portland Monthly’s website.
- Average year homes built in the community: 1978
- Percent of residents below poverty level: 14.7%
- Percent of neighborhood land area that is in parks: 7%
- Commute by public transportation: 8.3%
- Commute by bike or walking: 5.7%
1Beaverton Home Prices: 2007-2015
- Number of Homes Sold in Beaverton—► 1,619 homes sold in 2015 and 1.4% were distressed sales. 1,189 homes sold in 2014 and 8% were distressed sales. 1,114 homes sold in 2013 and 15% were distressed sales. 1,089 homes were sold in 2012 and 33% were distressed sales. In 2011 the number of homes sold was 823 and 12% were distressed sales. In 2010 there were 801 homes sold and 27% of these were distressed property sales.
- Median Price for Homes Sold in Beaverton—► $295,000 in 2015, $279,000 in 2014, $255,000 in 2013, $219,000 in 2012, $215,000 in 2011, $230,000 in 2010, $245,000 in 2009, $266,000 in 2008, and $245,000 in 2007.
- Average Cost per Square Foot—► $181 in 2015, $163 in 2014.
- 1-Year Median Sales Price Change in Beaverton—► 5.4% sales price change in 2015. In 2014 the change was 10%, the change was 16% in2013, the change was 2% in 2012, the change was -5% in 2011, and in 2010 the change was -8%.
- 5-Year Median Sales Price Change in Beaverton—► 37.2% sales price change for years 2011-2015. 2010 to 2014 the sales price change was 5%. 2009 to 2013 the sales price change was -4%. 2008 to 2012 the sales price change was -18%. 2007 to 2011 the sales price change was -25%. 2006 to 2010 the change was -16 %.
- Portland Metro Area Median Home Price—► $308,000 in 2015, $288,500 in 2014, $265,000 in 2013, $235,000 in 2012, $221,000 in 2011, $239,900 in 2010, $247,000 in 2009, $278,000 in 2008, and $290,000 in 2007.
- Portland Metro Area Average Home Price—► $354,500 in 2015, $333,000 in 2014, $310,600 in 2013, $275,000 in 2012, $263,300 in 2011, $282,100 in 2010, $289,900 in 2009, $330,300 in 2008, and $342,000 in 2007.
Please be aware that the above figures are subject to error and are intended as guidelines only.
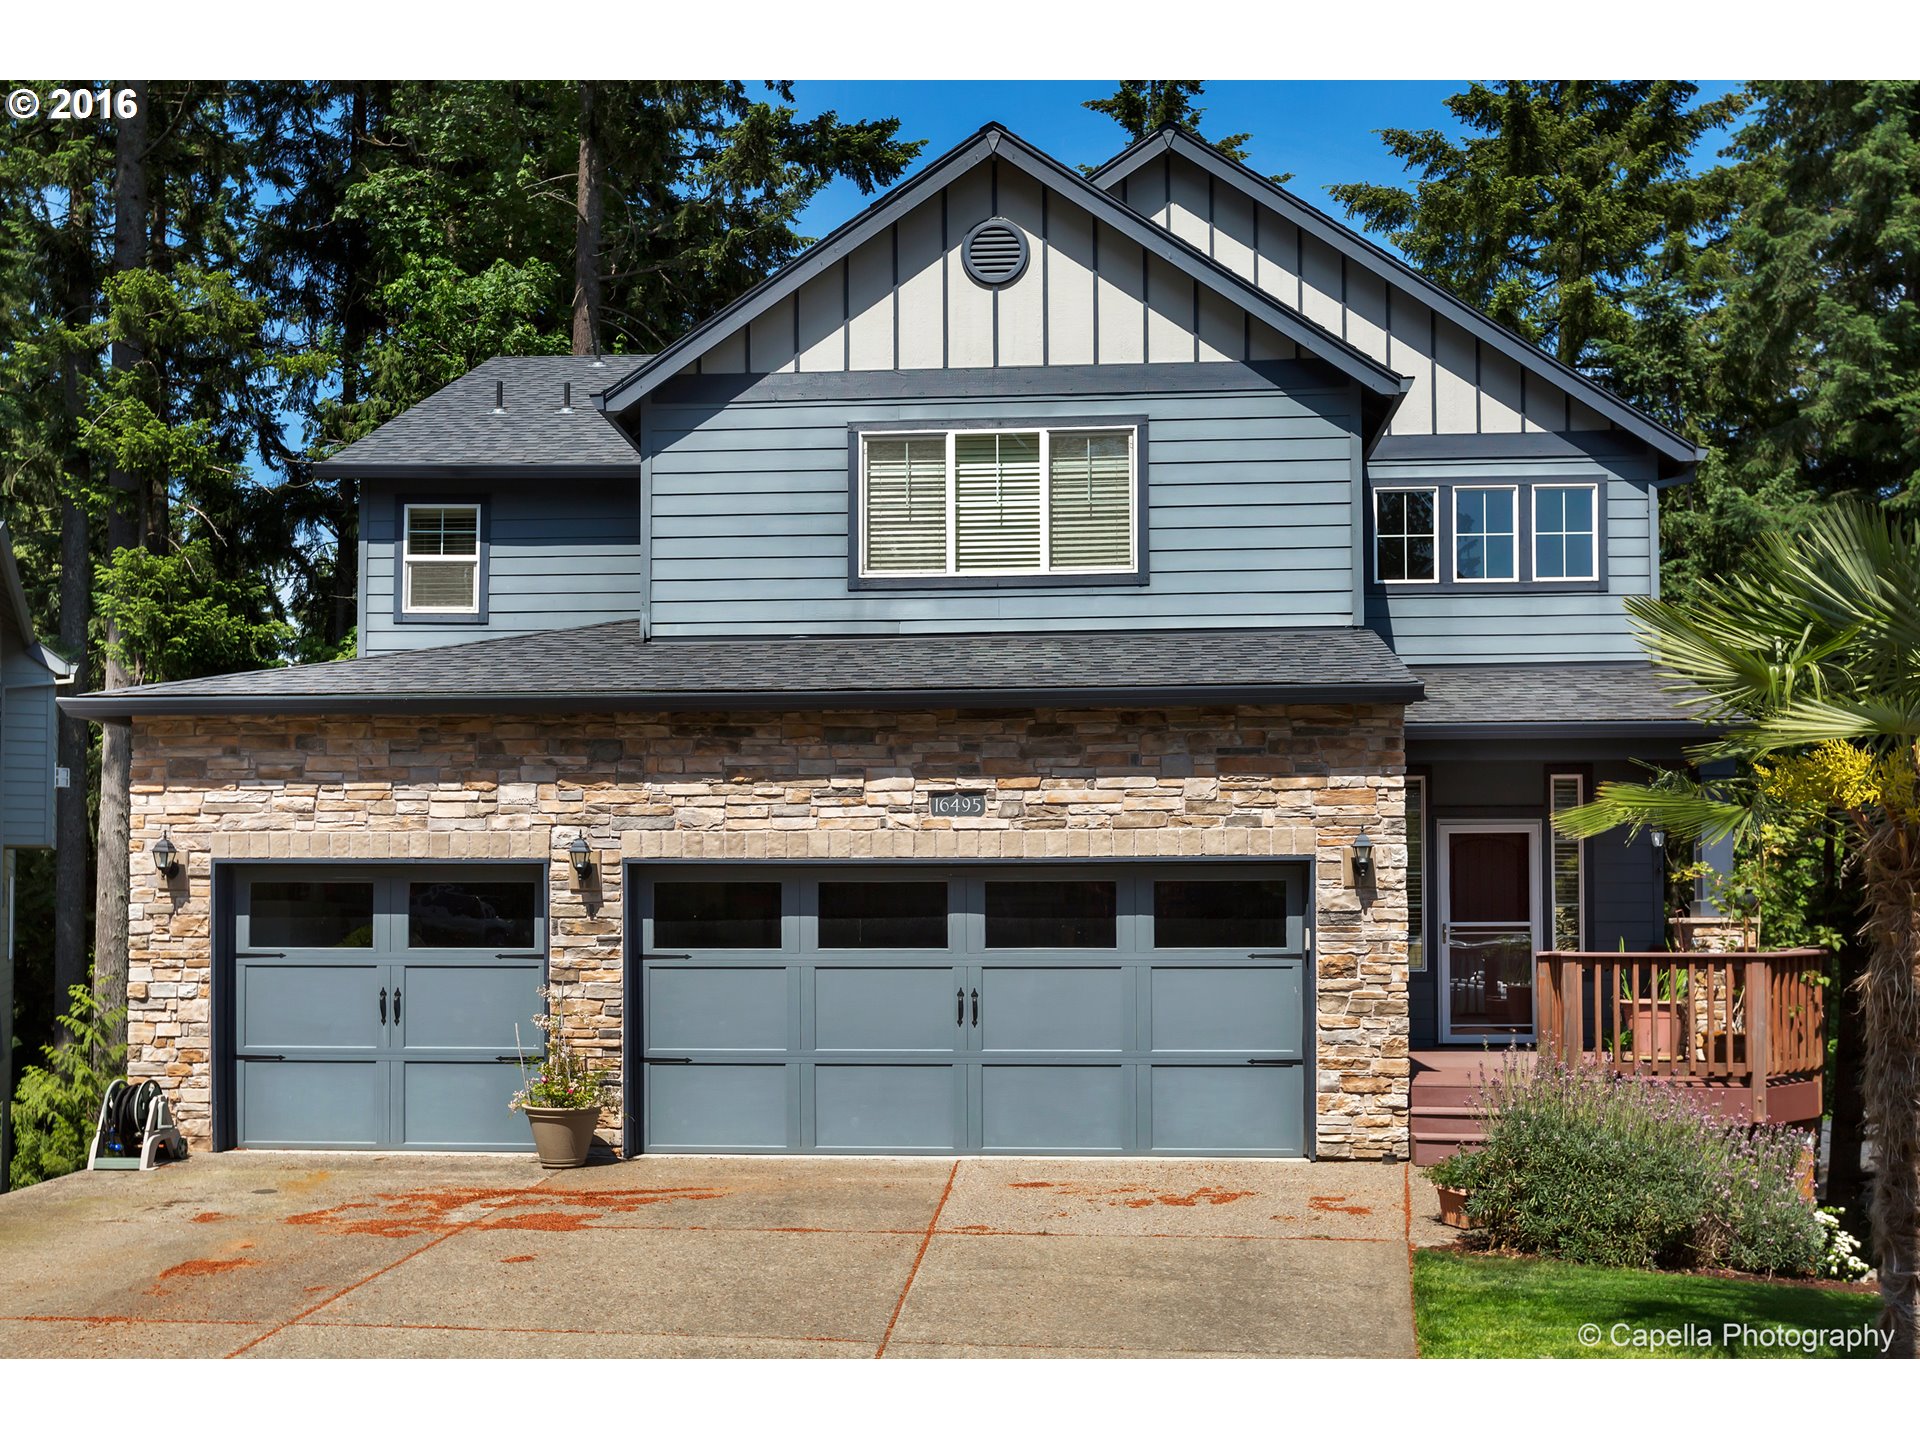
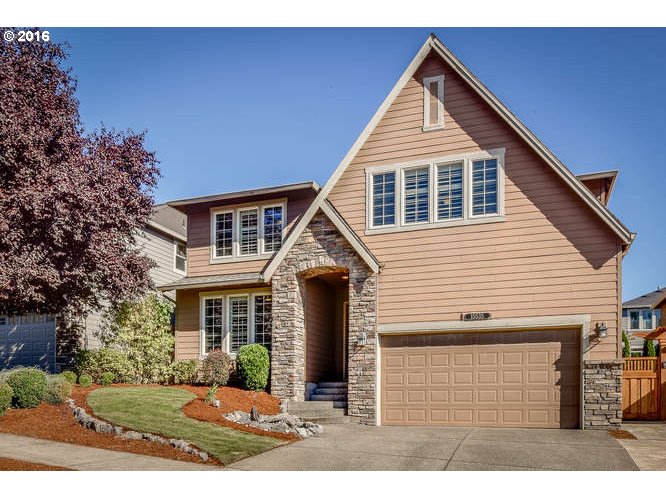
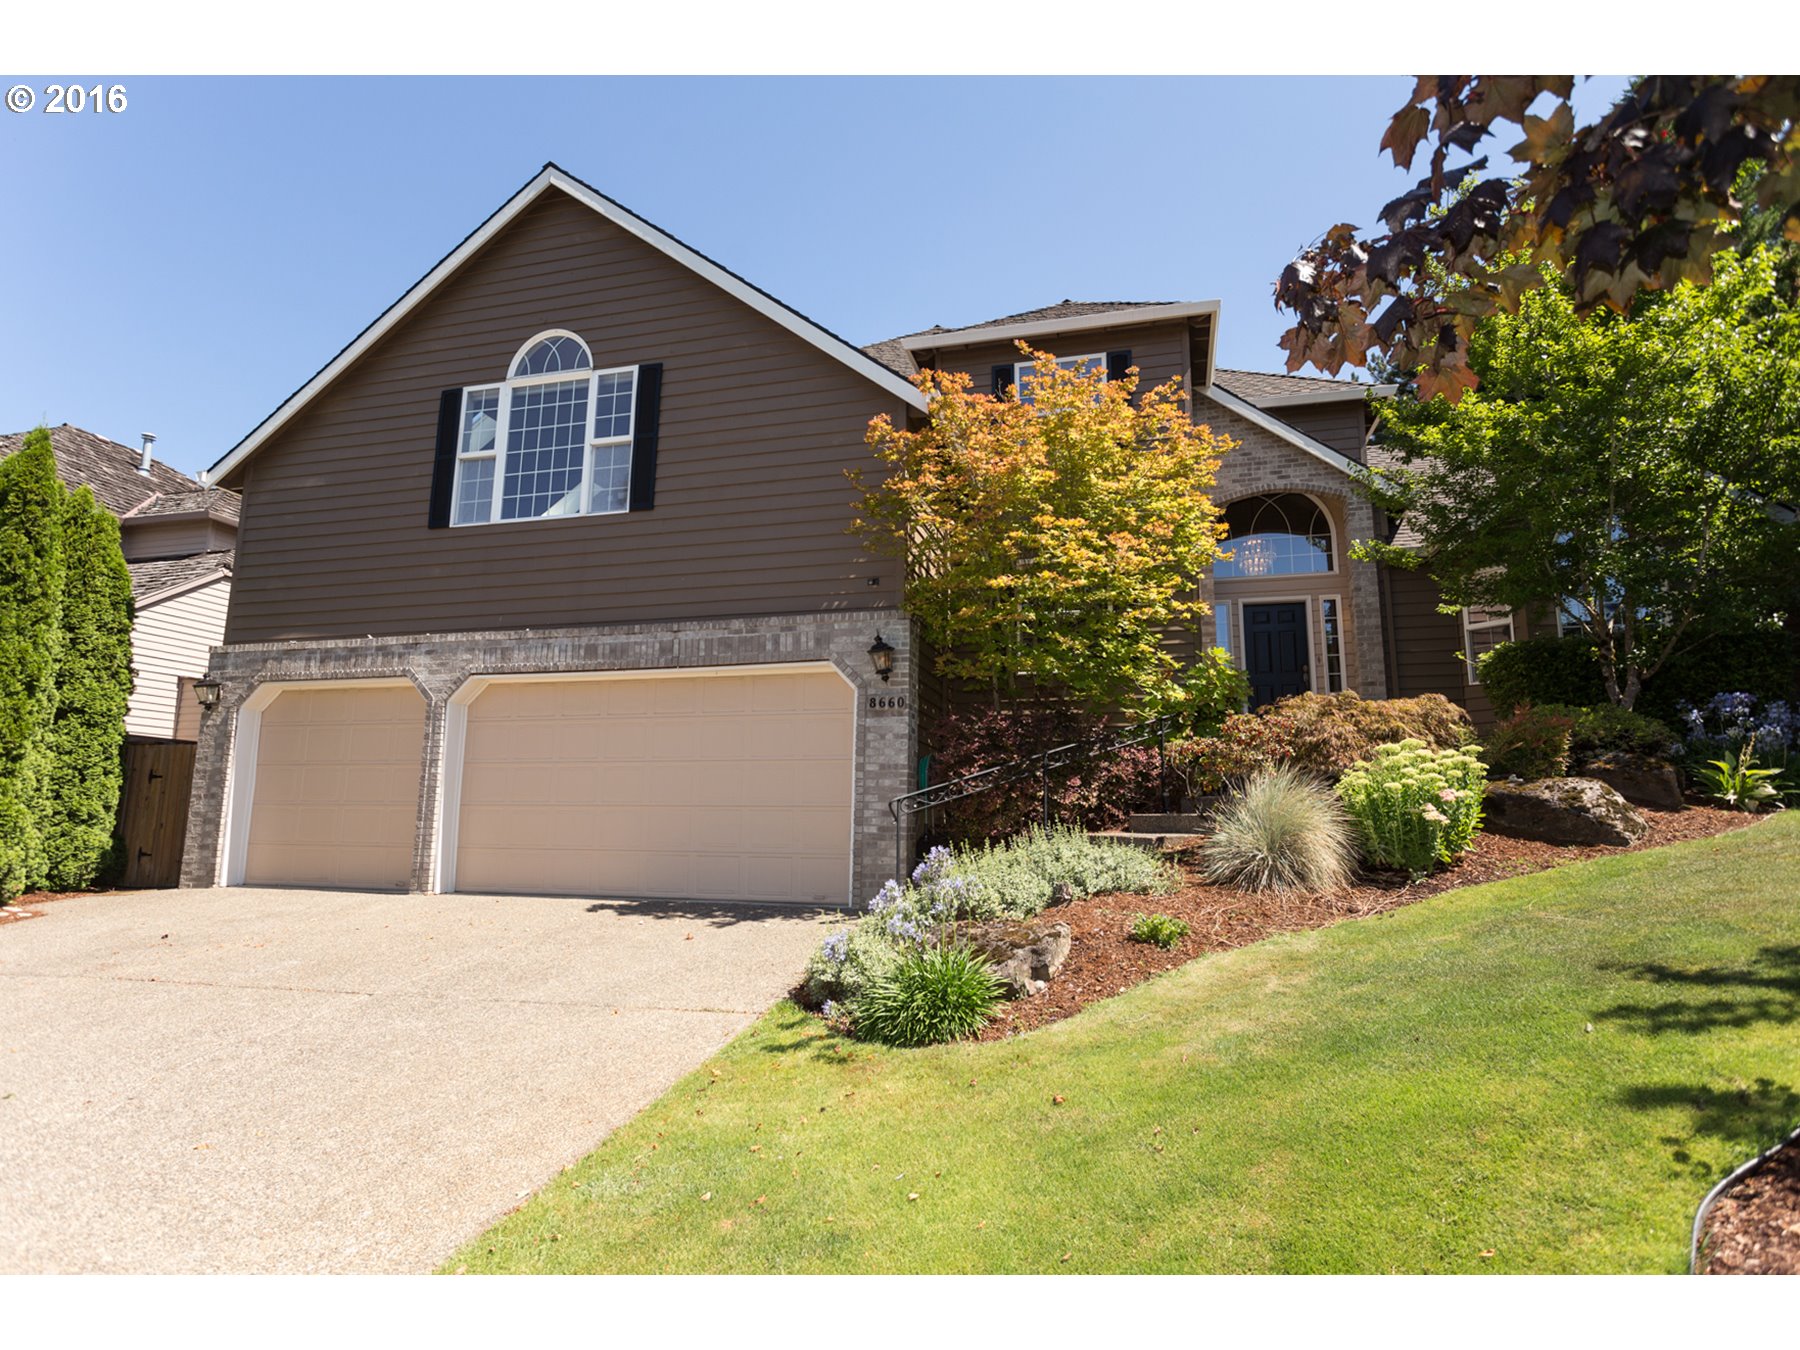
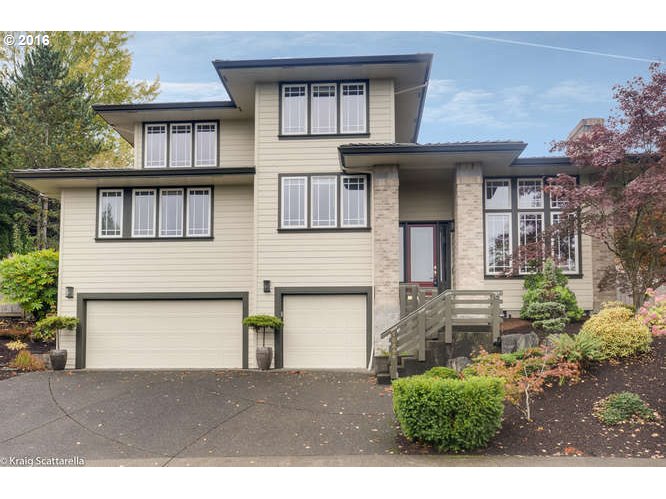
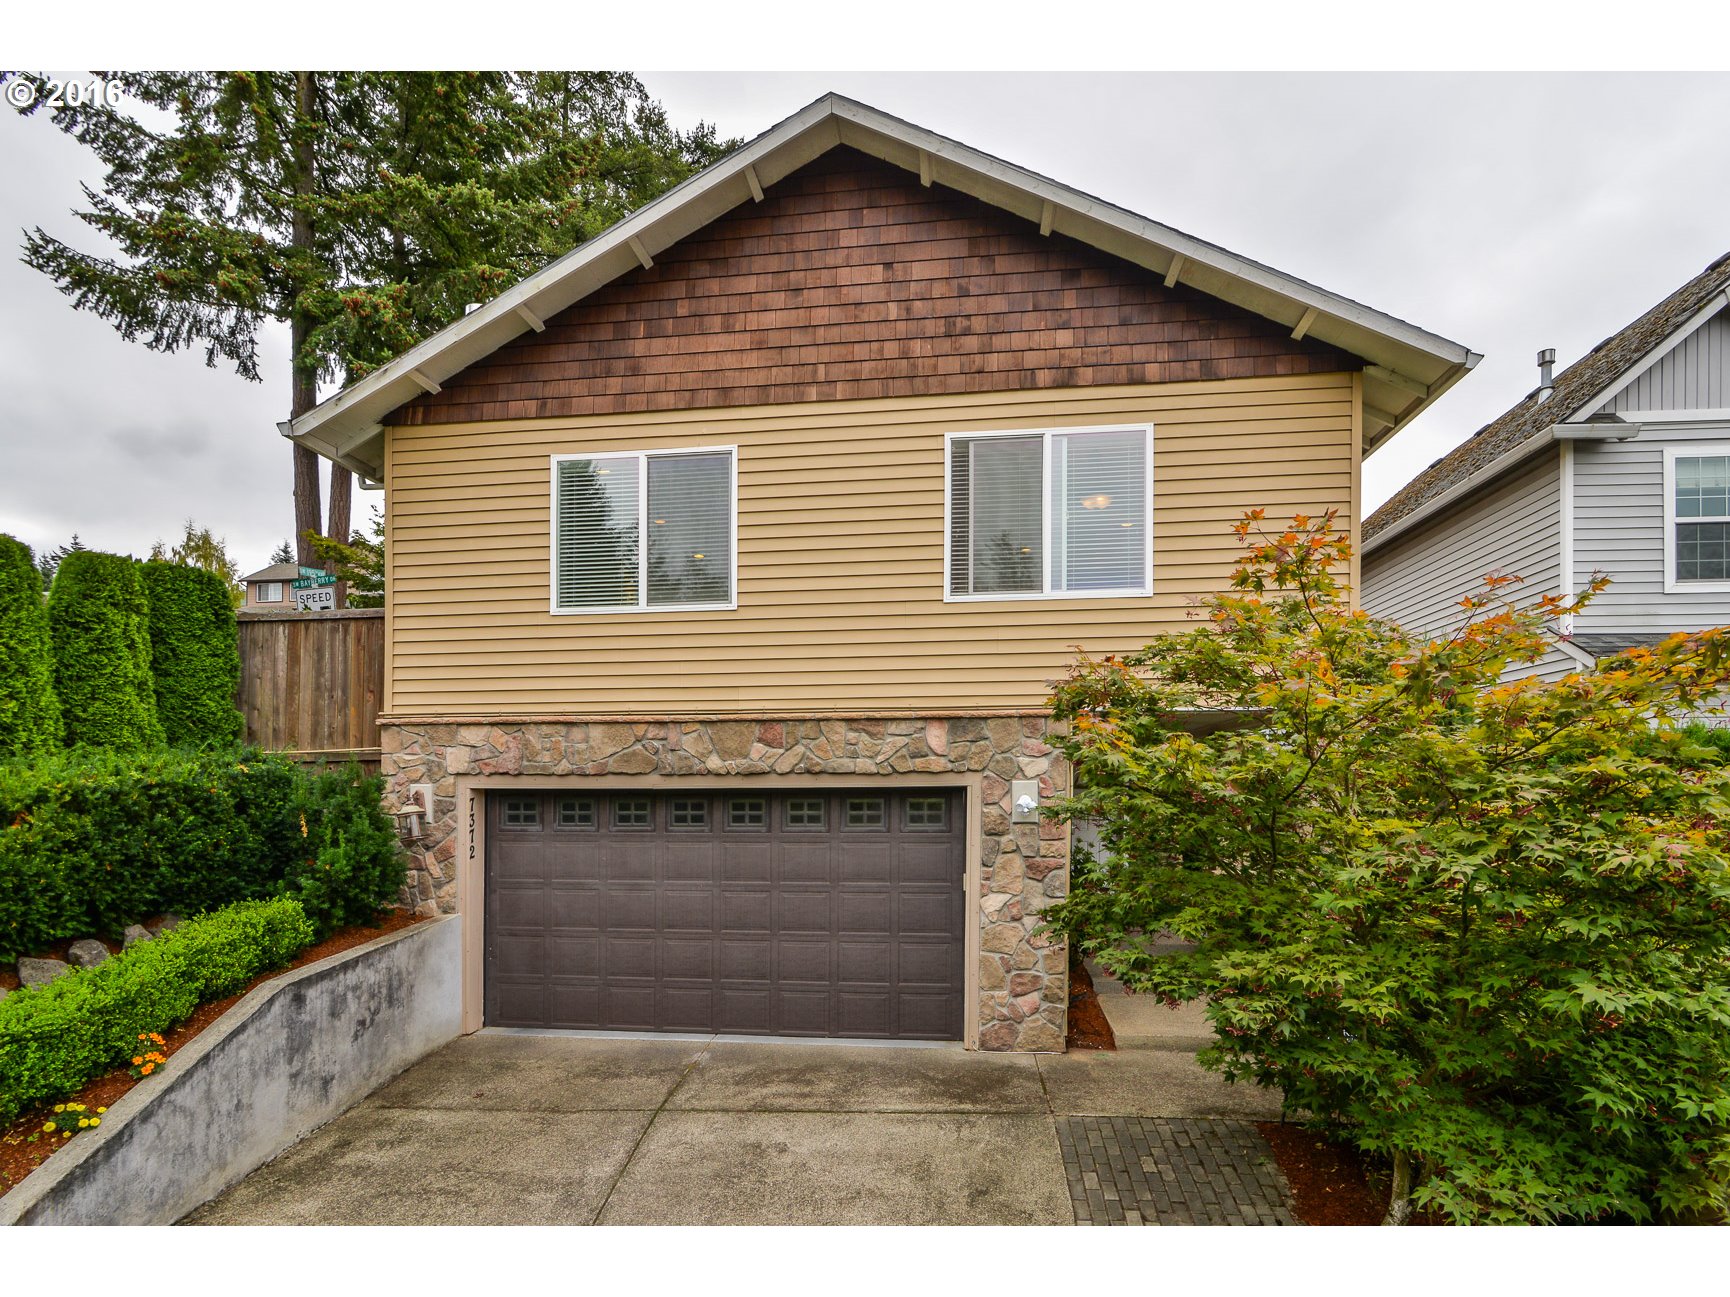
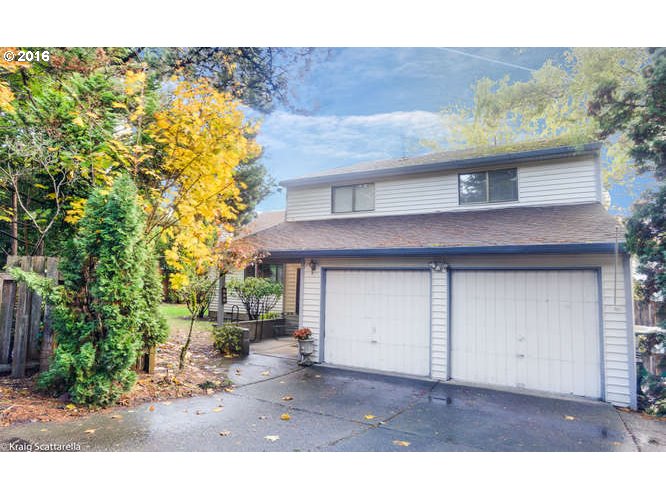
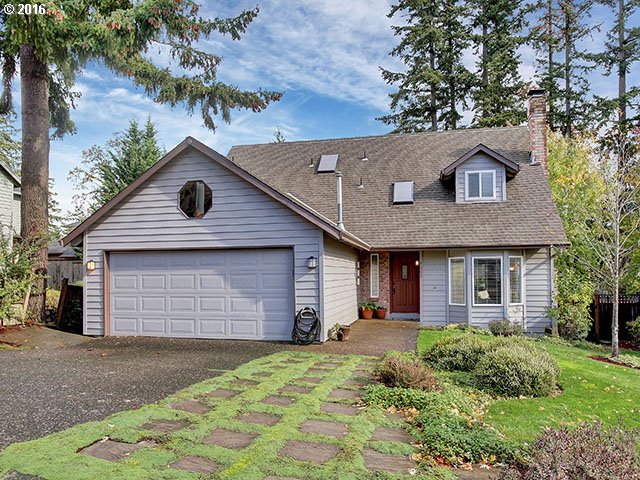
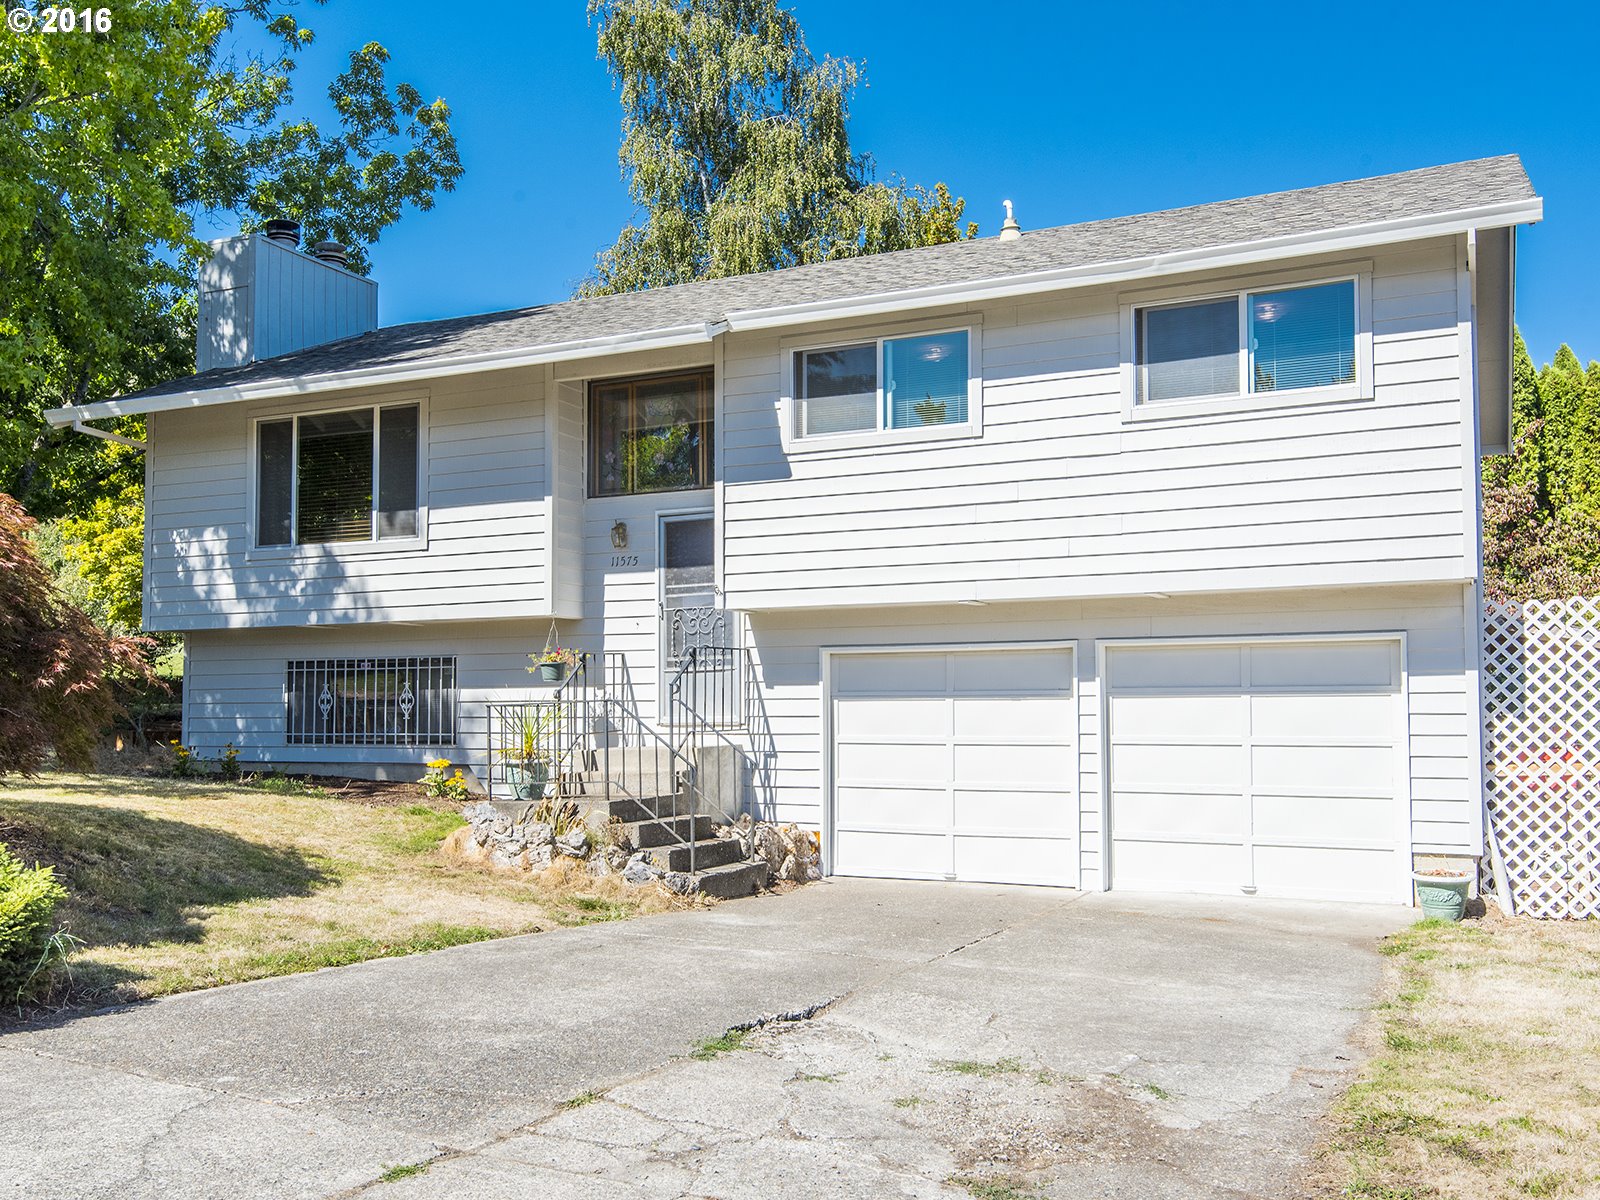
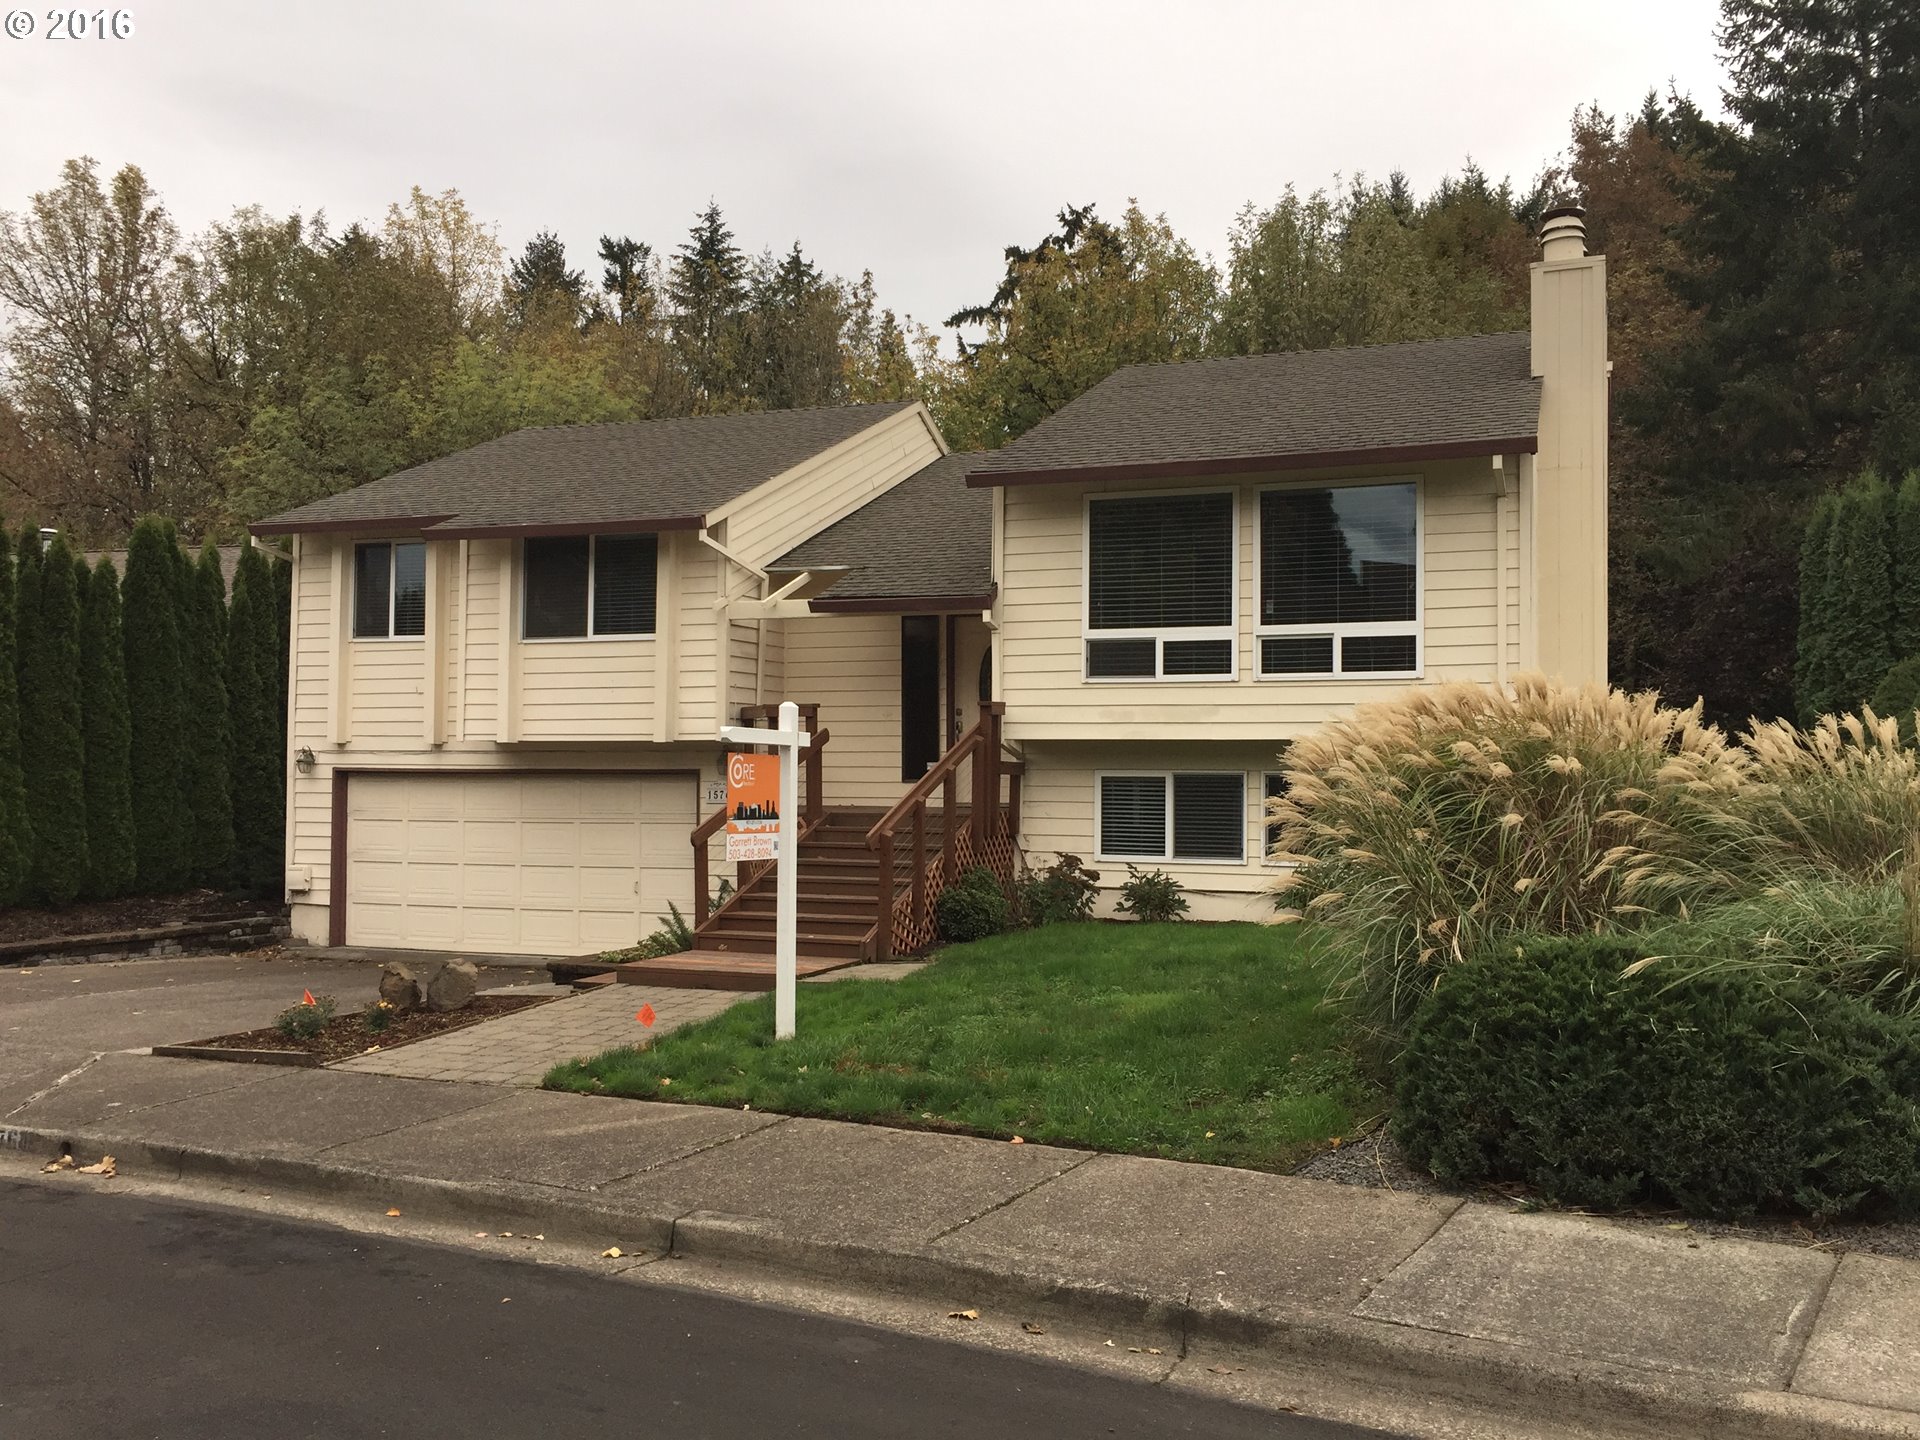
Find a Home in the City of Beaverton
- Homes for Sale in Beaverton — View on all devices except Apple® mobile devices. To view homes for sale in the City of Beaverton on Apple® mobile devices key in “Beaverton” in the “Location” field and click on the “Search Now” icon.
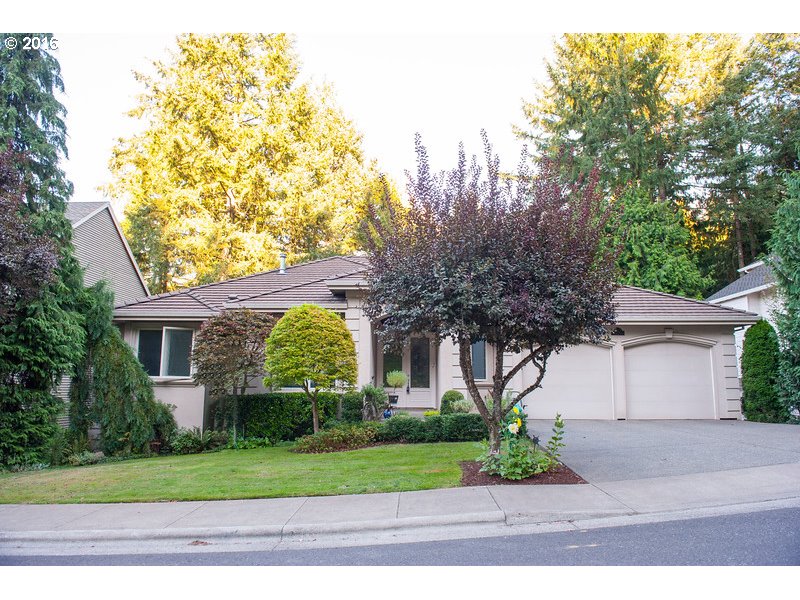
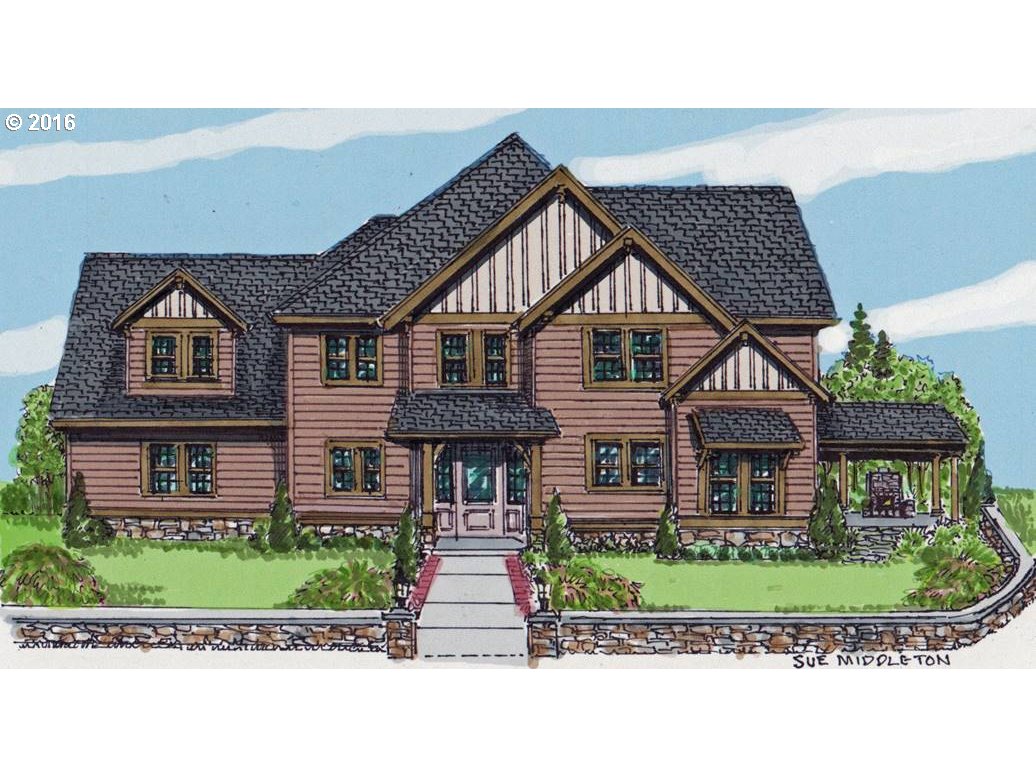
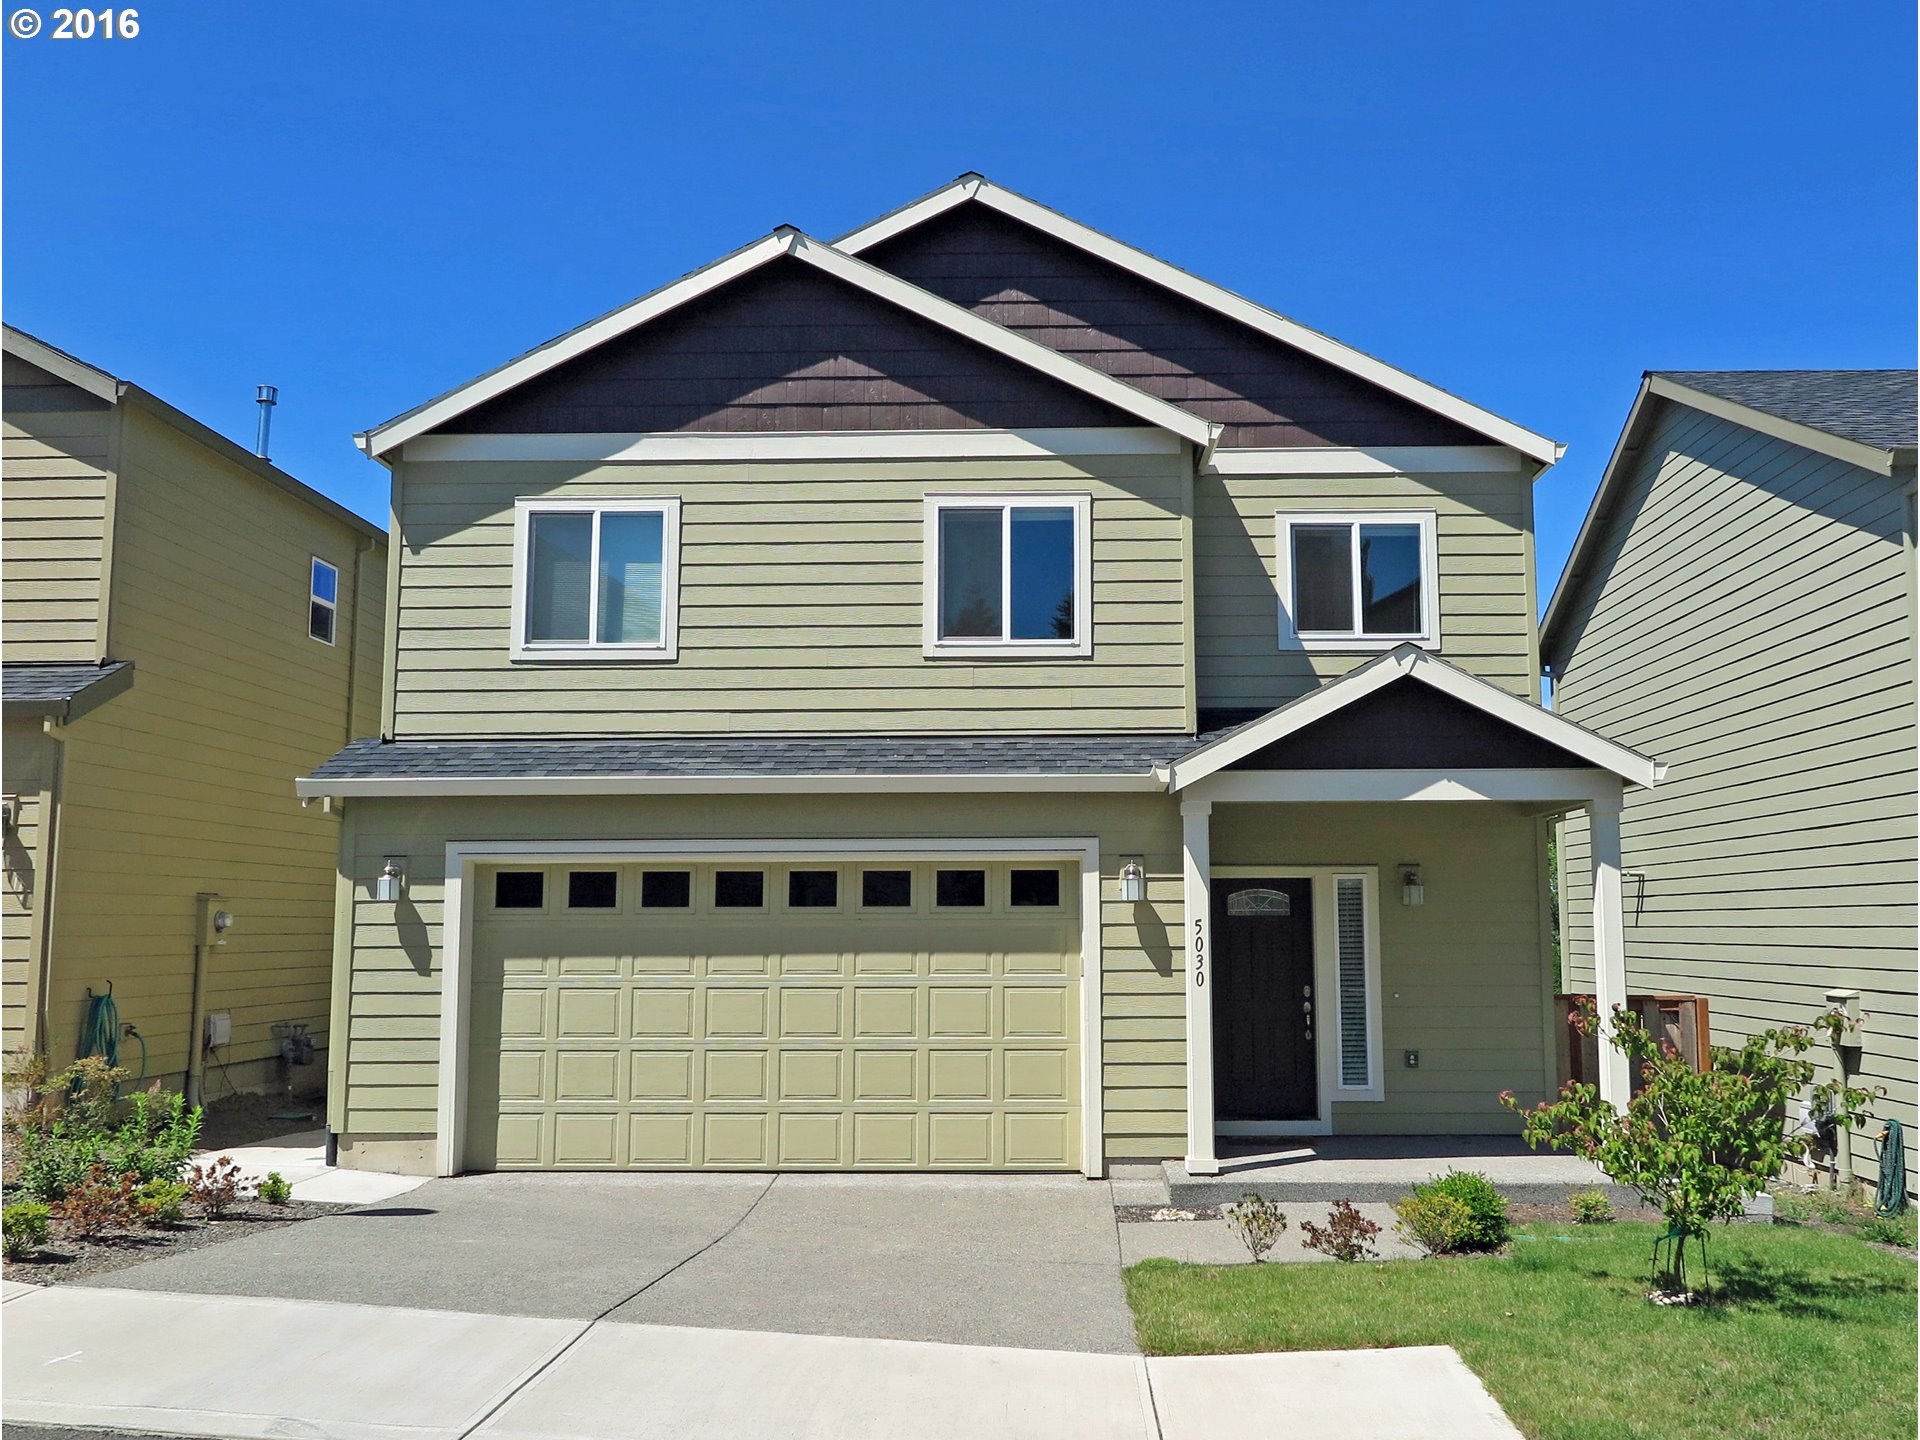
- Displays All Homes for Sale in Beaverton — View on all devices. Photos of homes displayed along with detailed description of property.
- Displays Homes New on the Market in Beaverton — View on all devices. Photos of homes displayed along with detailed description of property.
- Search for Homes — Search on all devices. Map-based on devices configured with Adobe Flash and Javascript and text-based on any device.
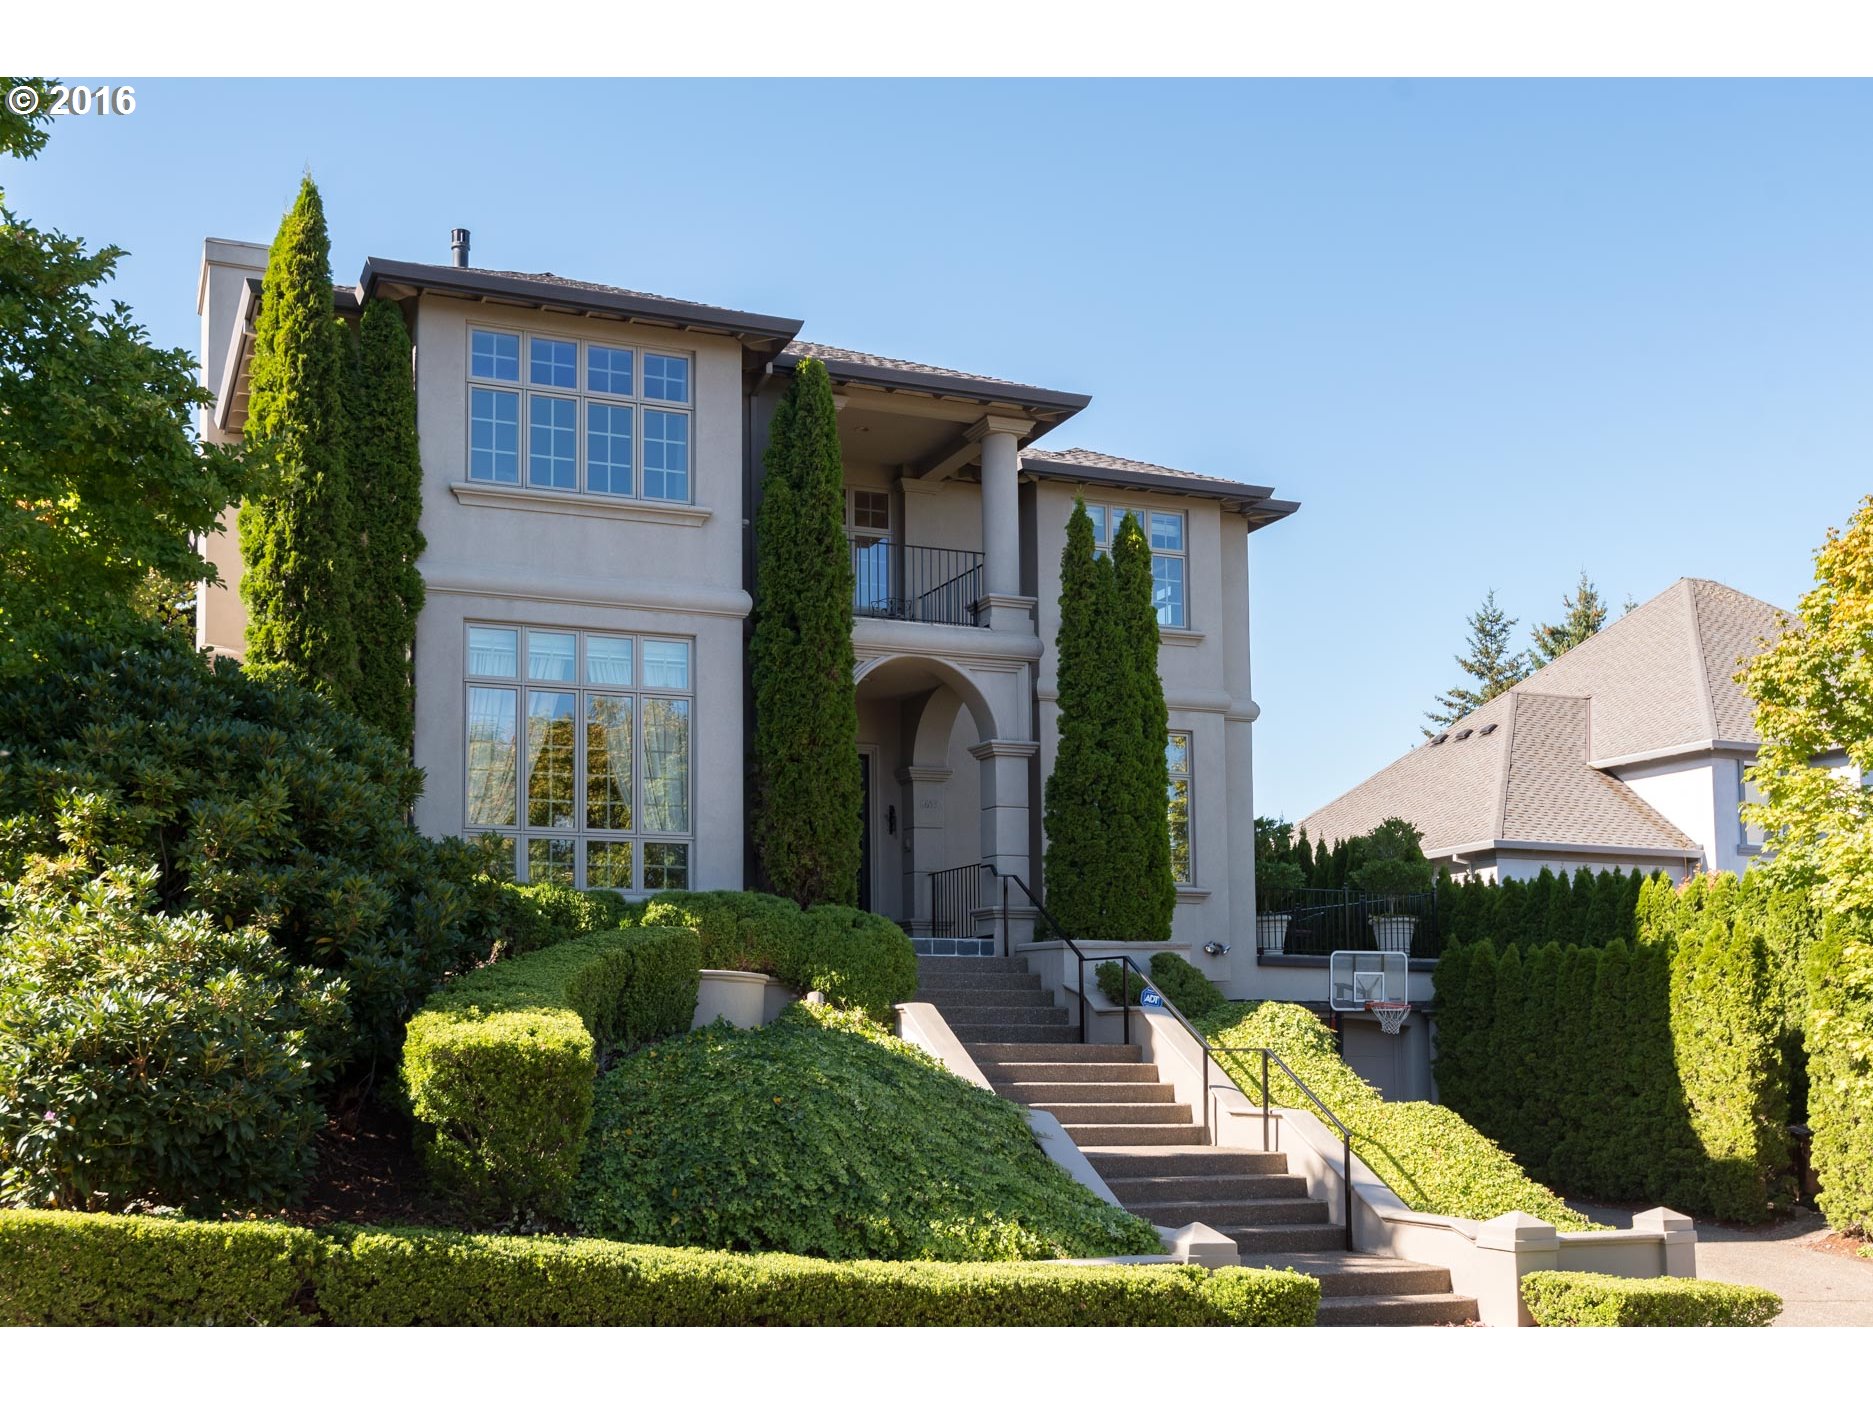
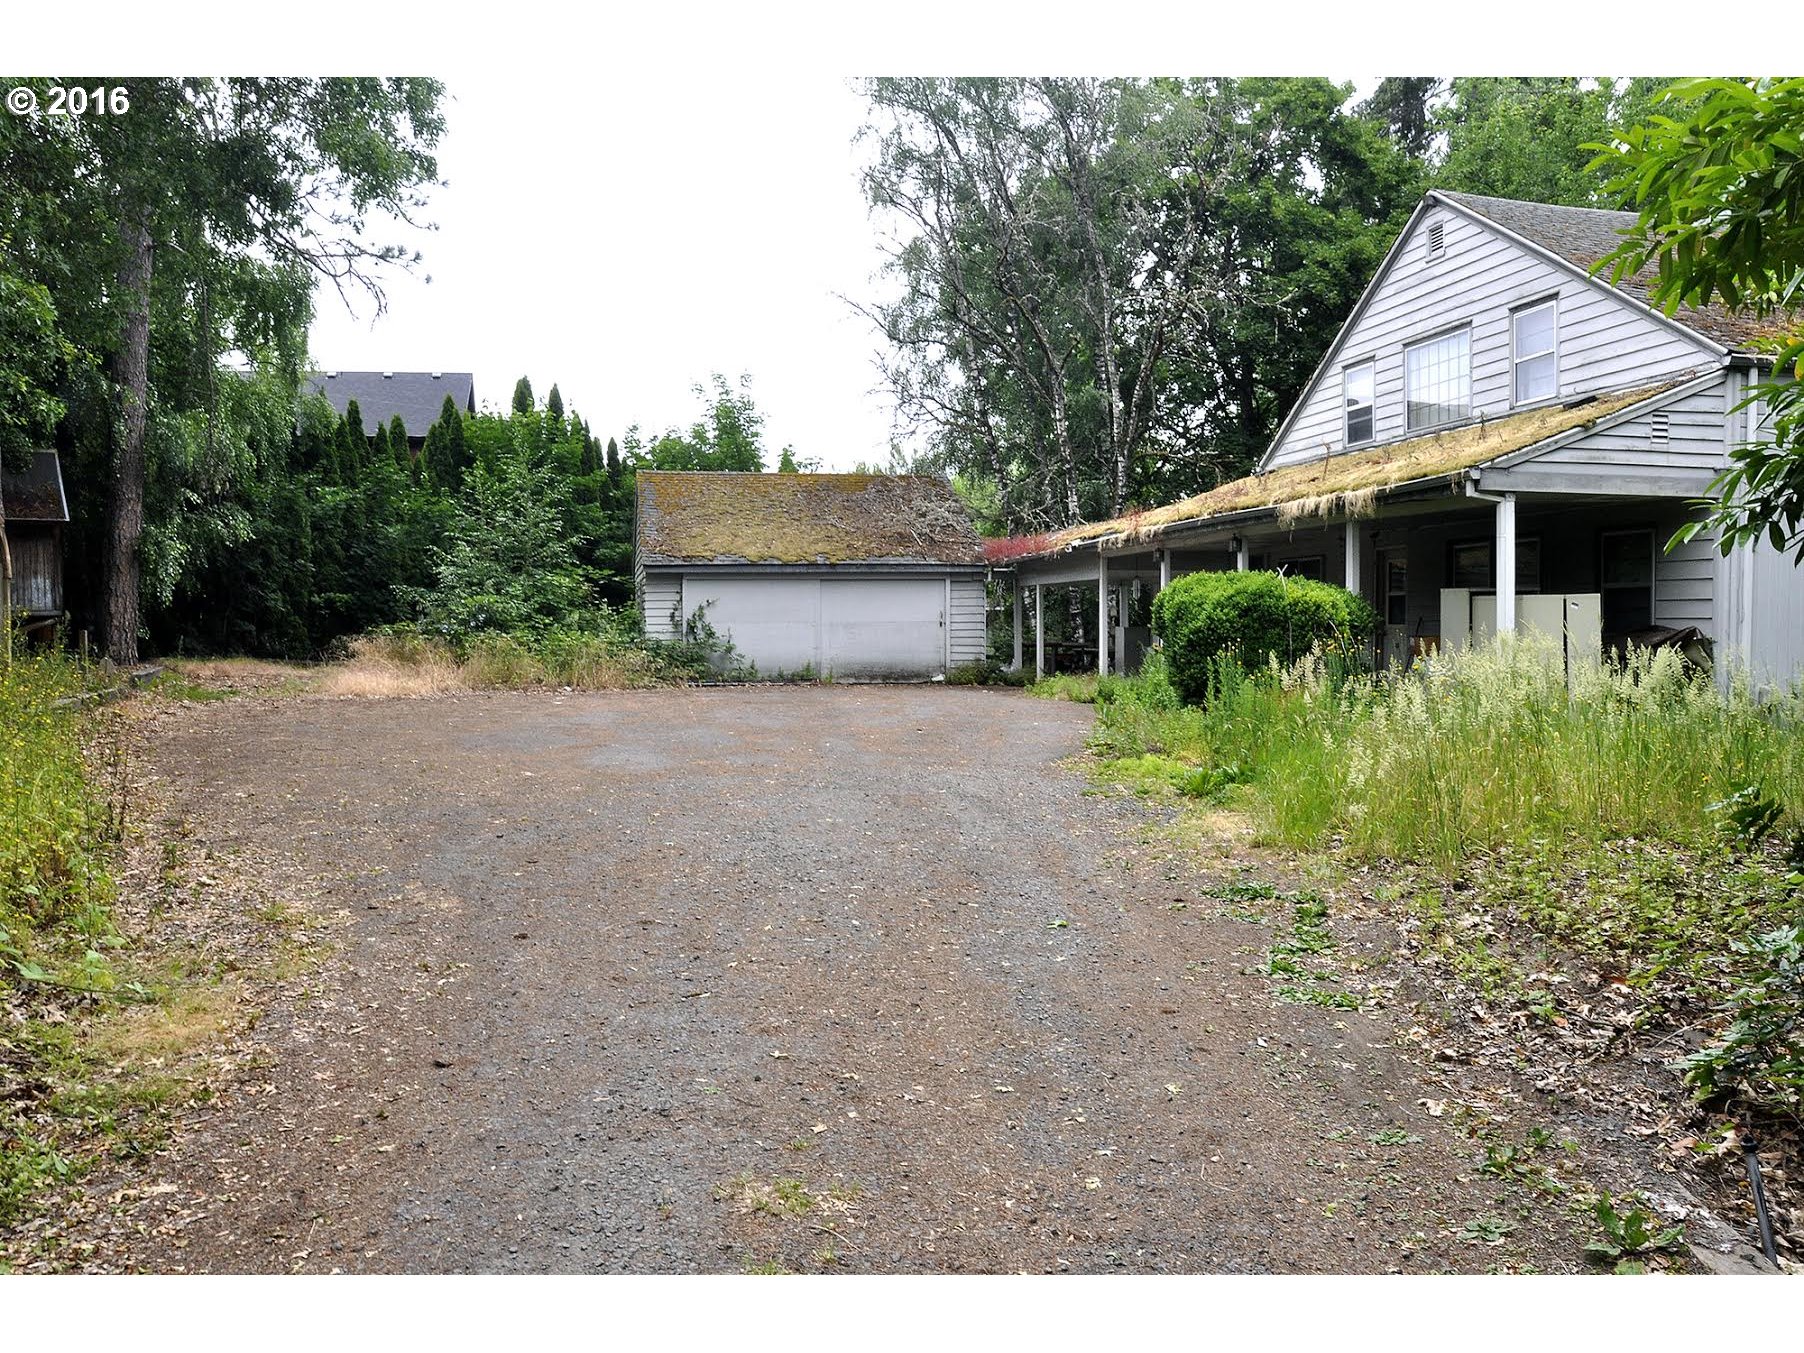
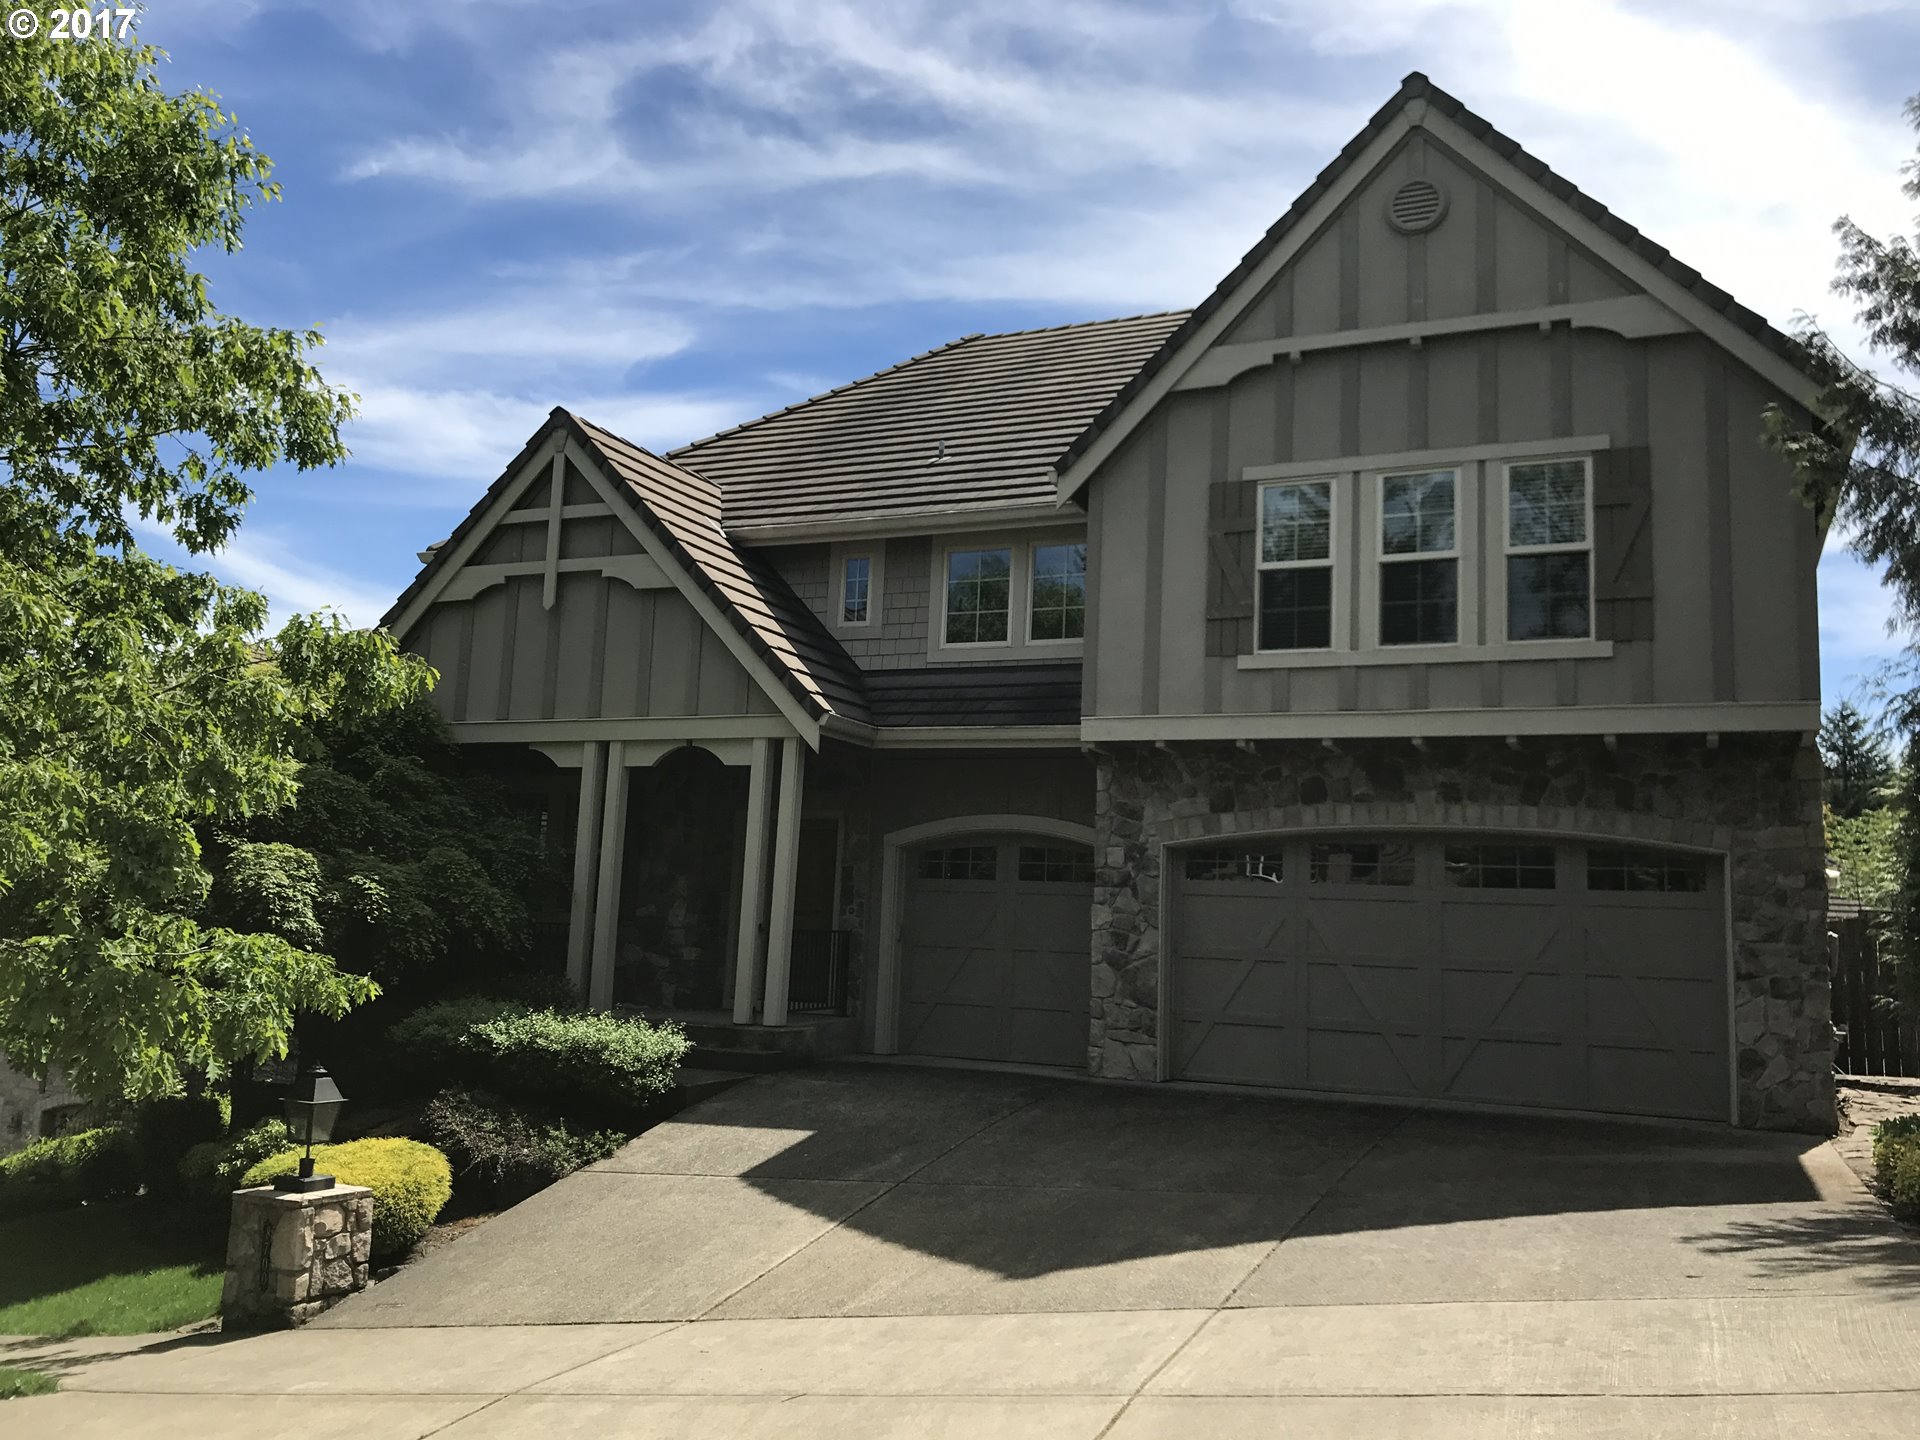
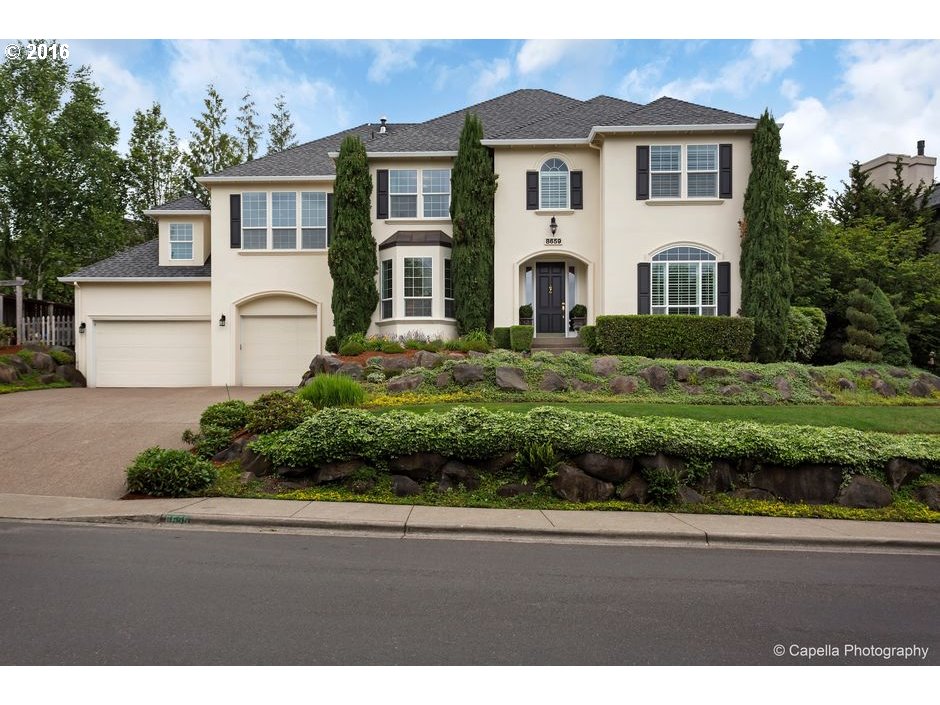
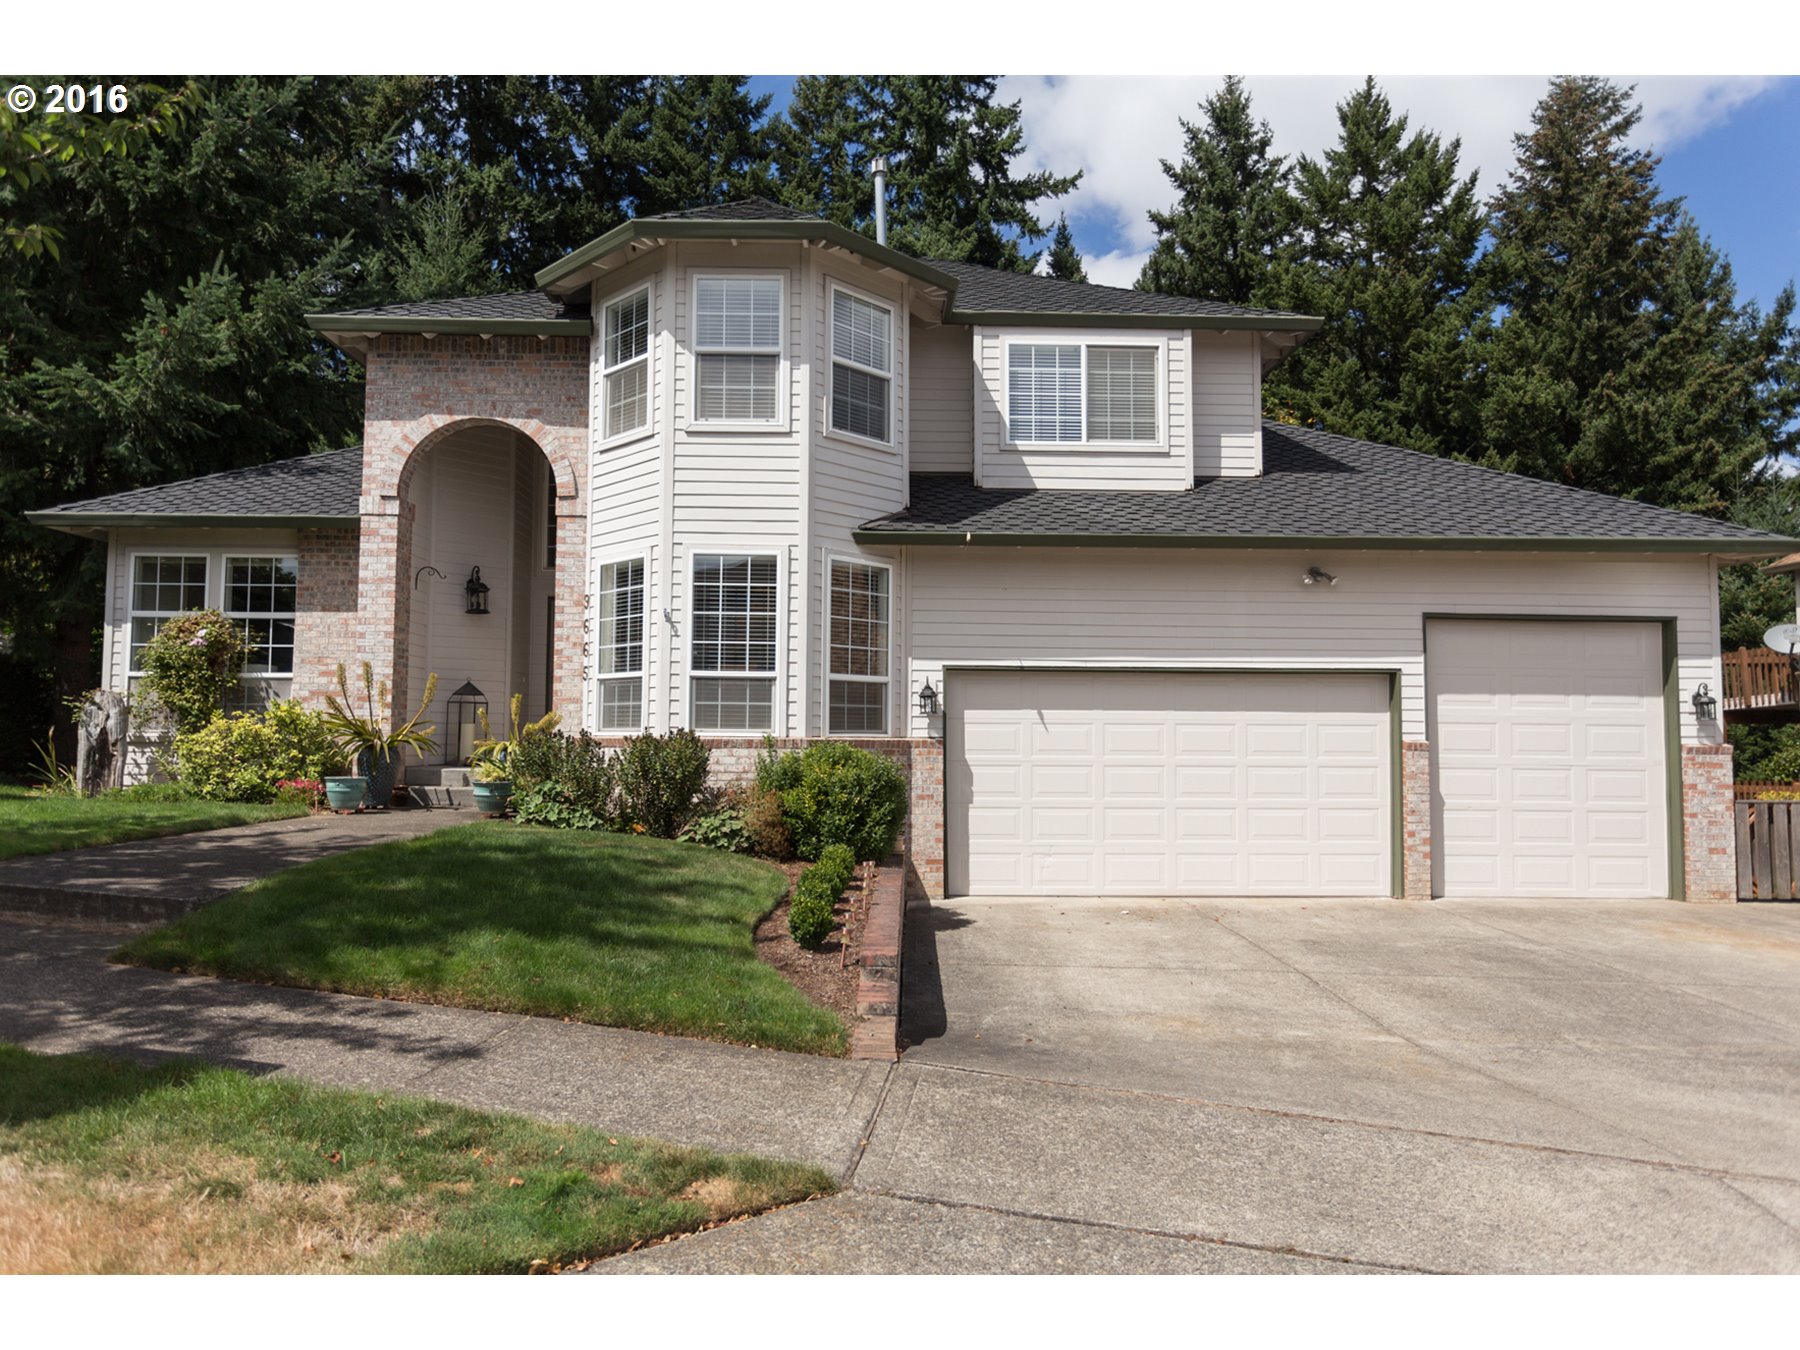
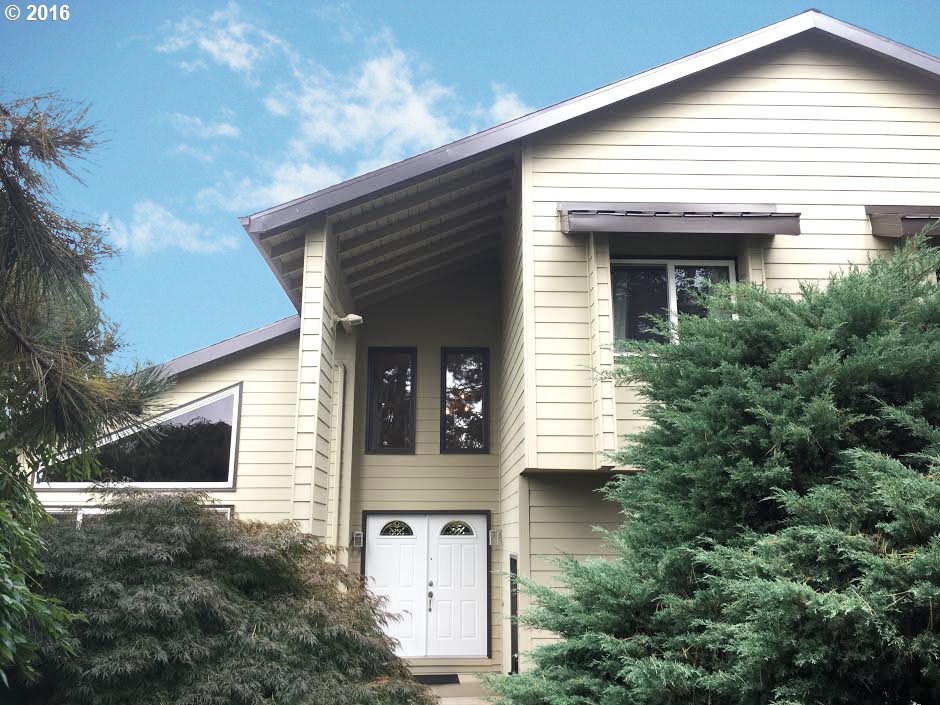
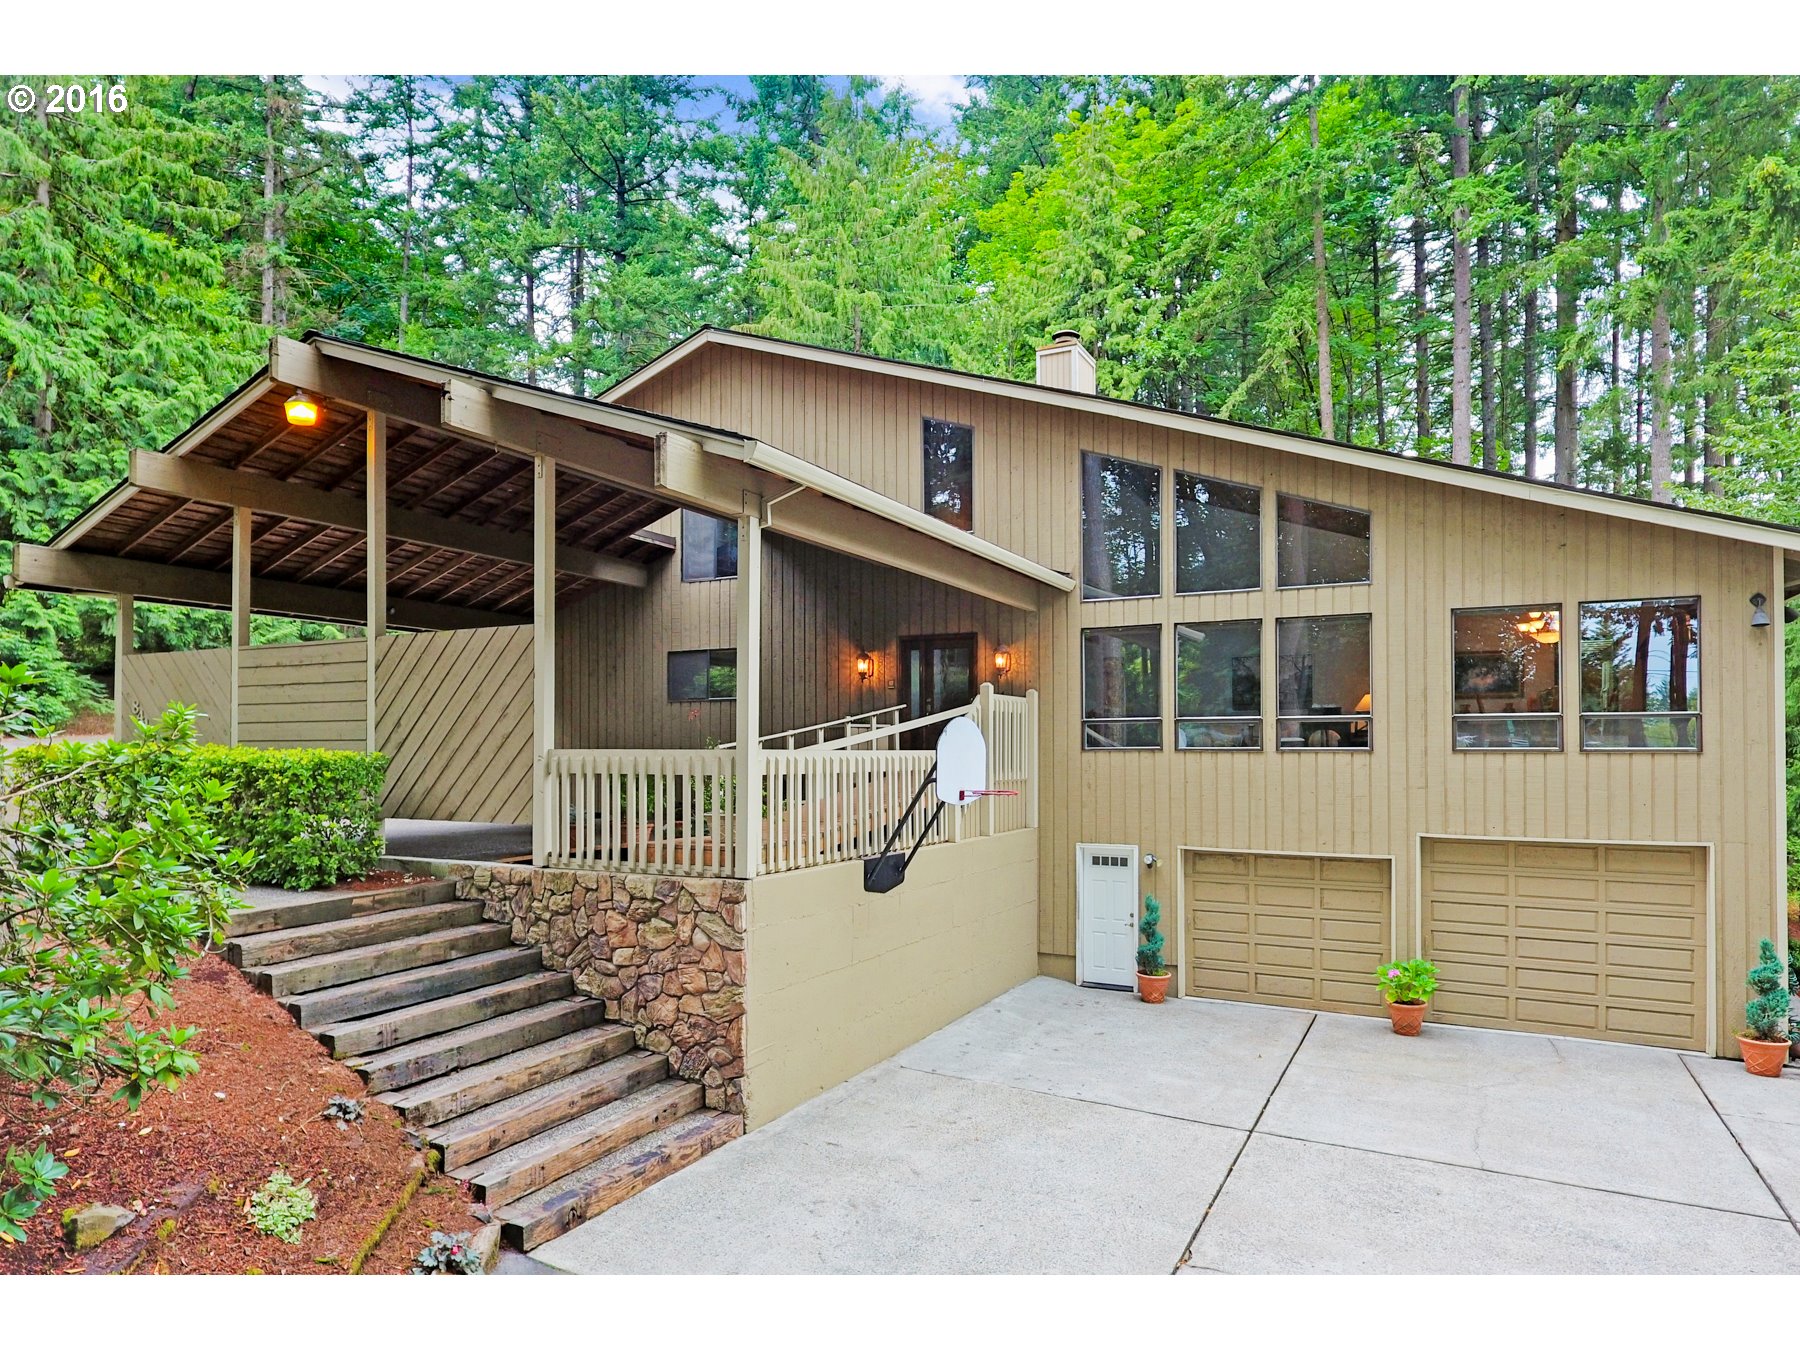
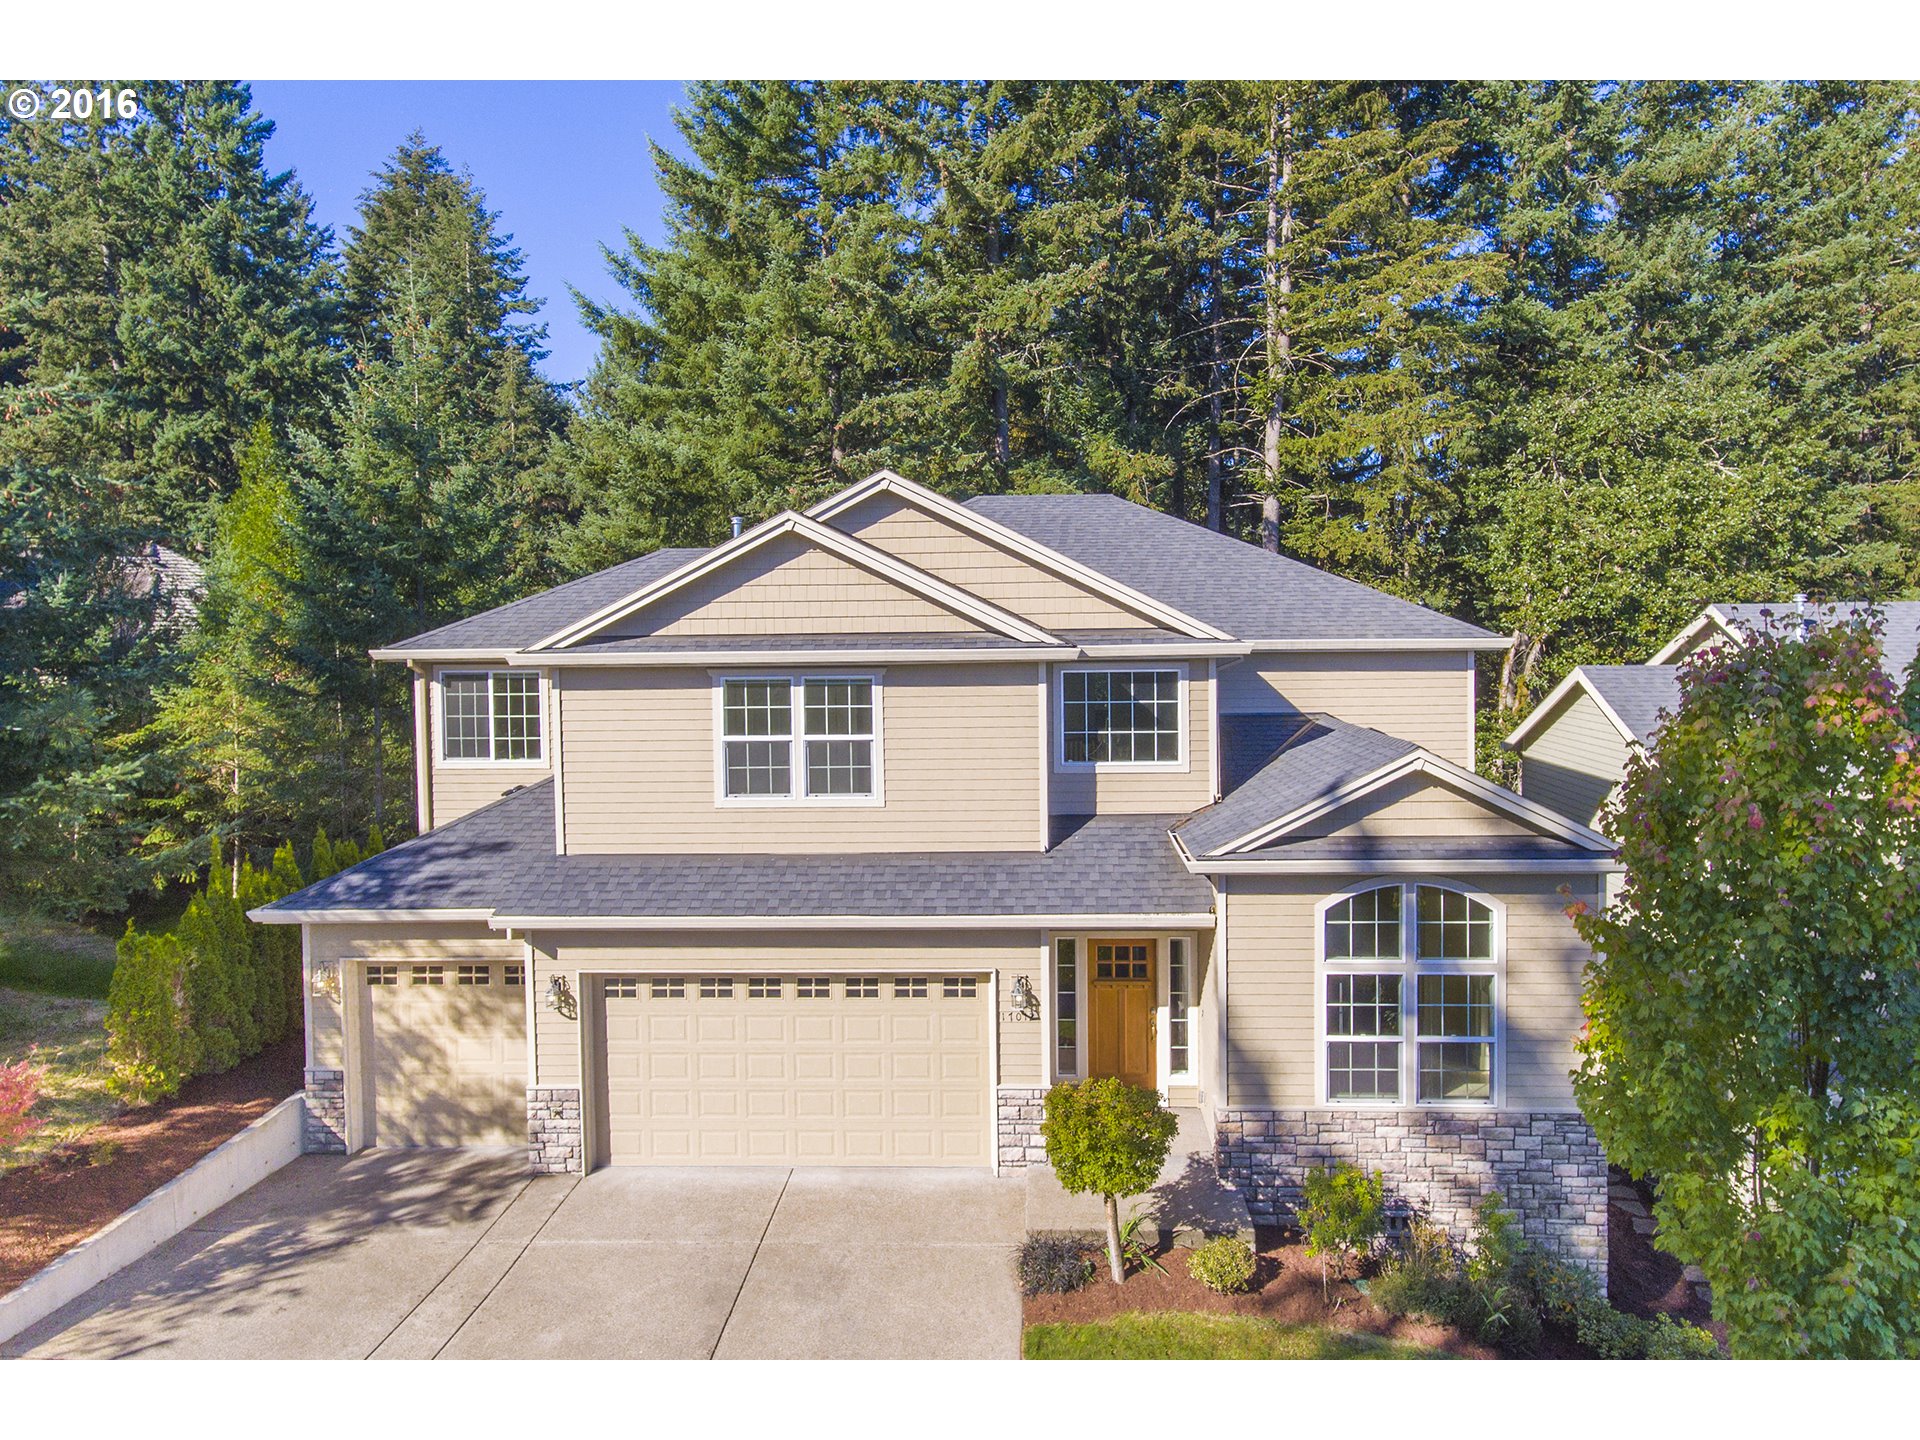
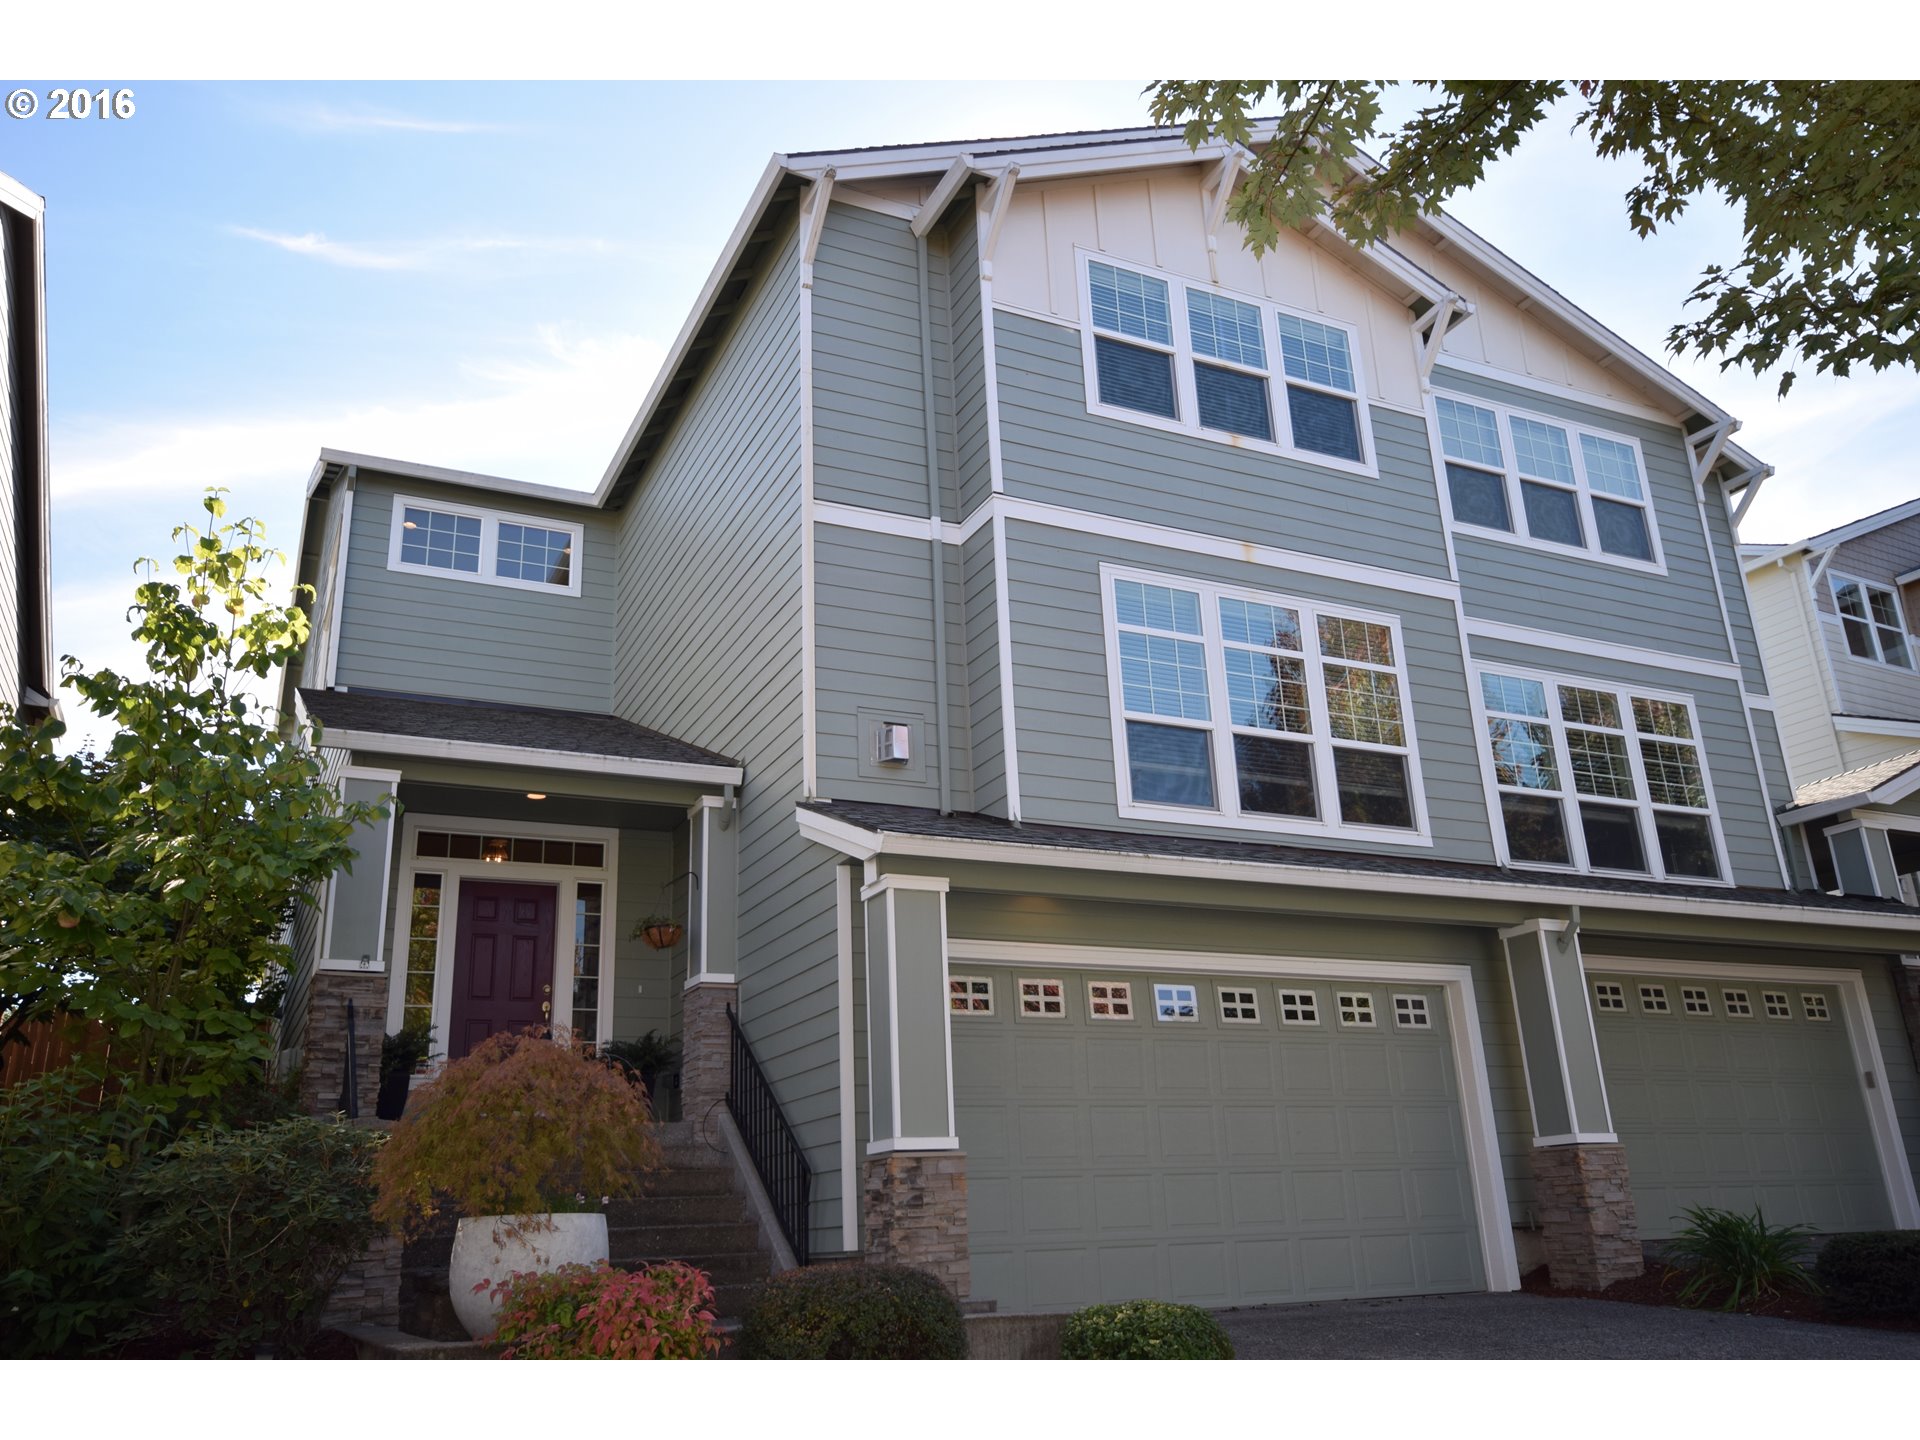
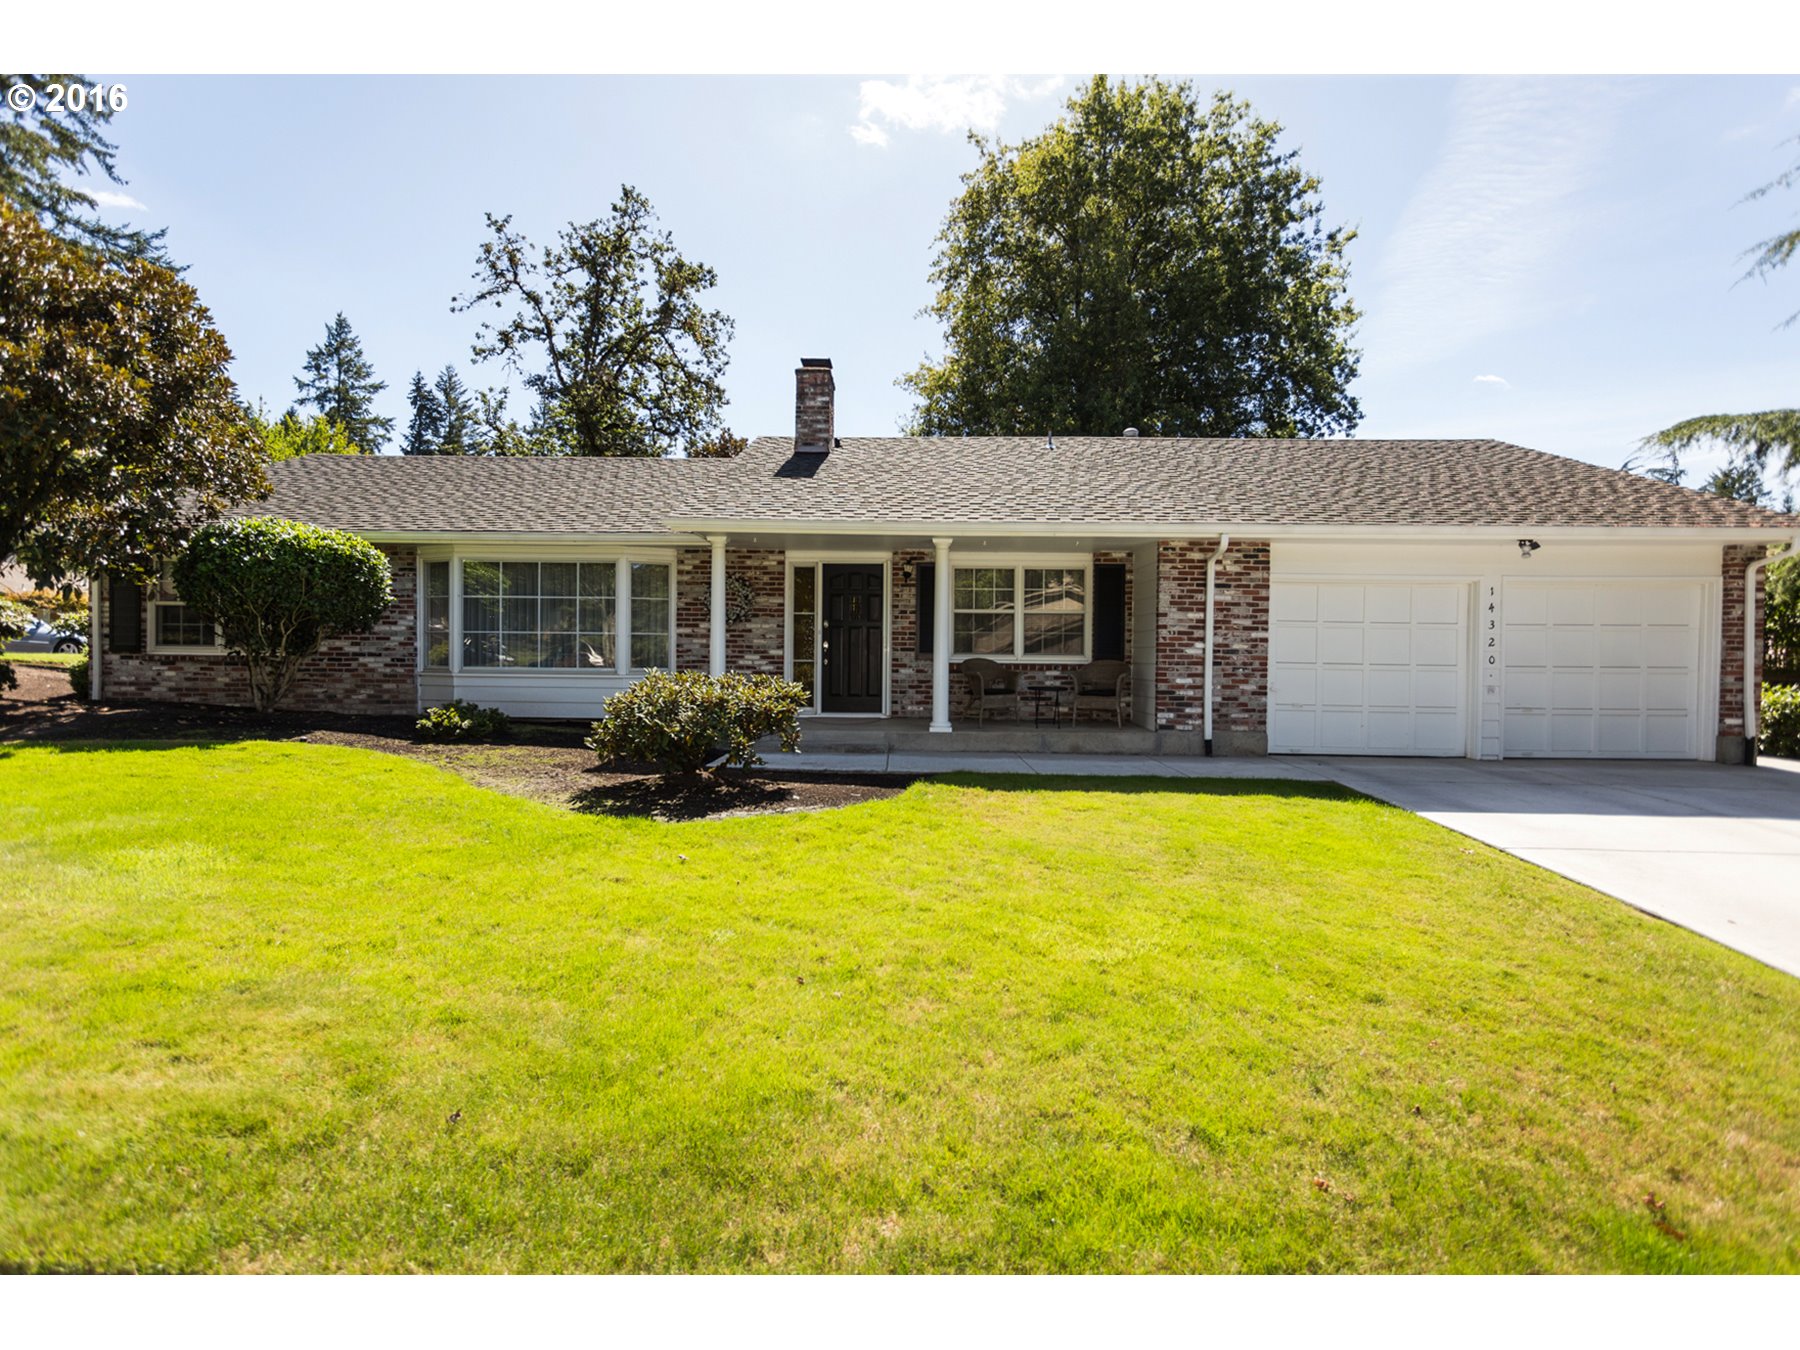
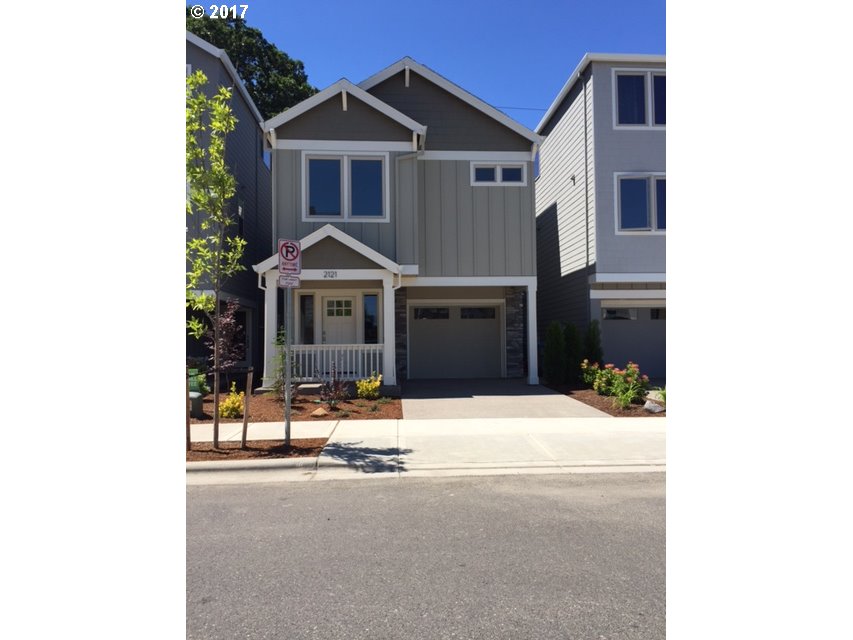
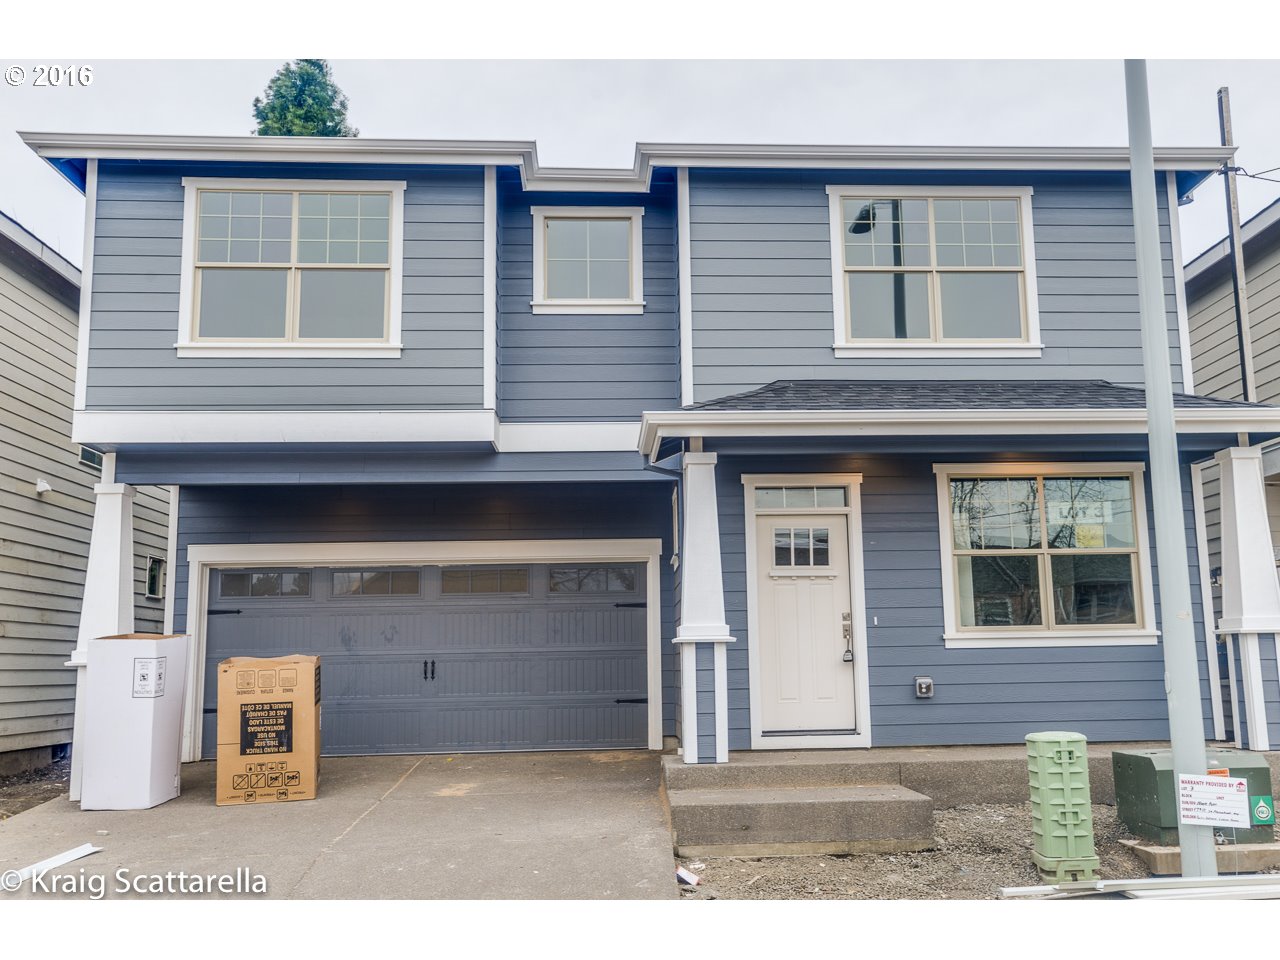
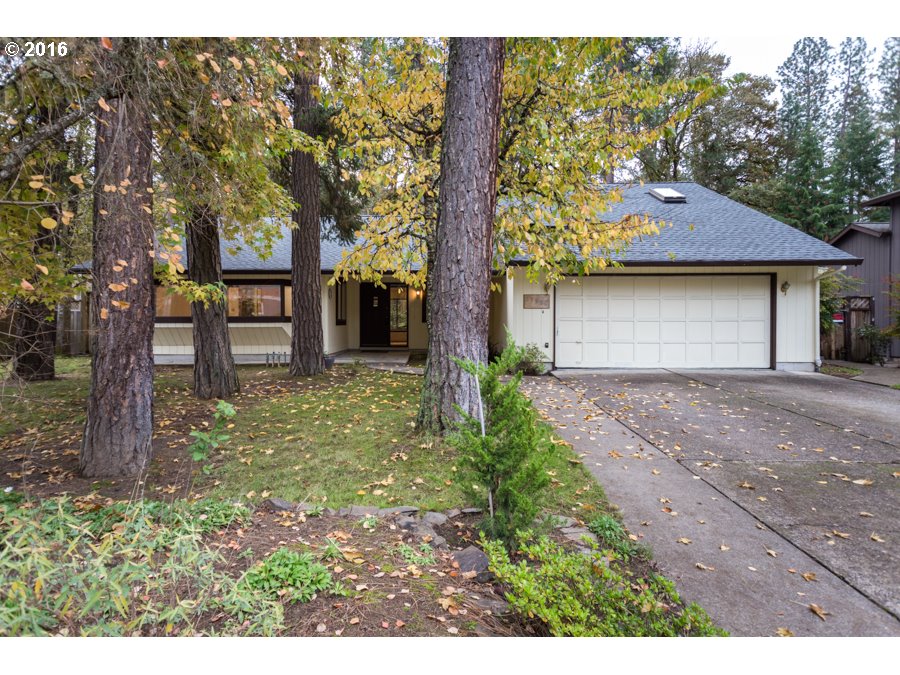
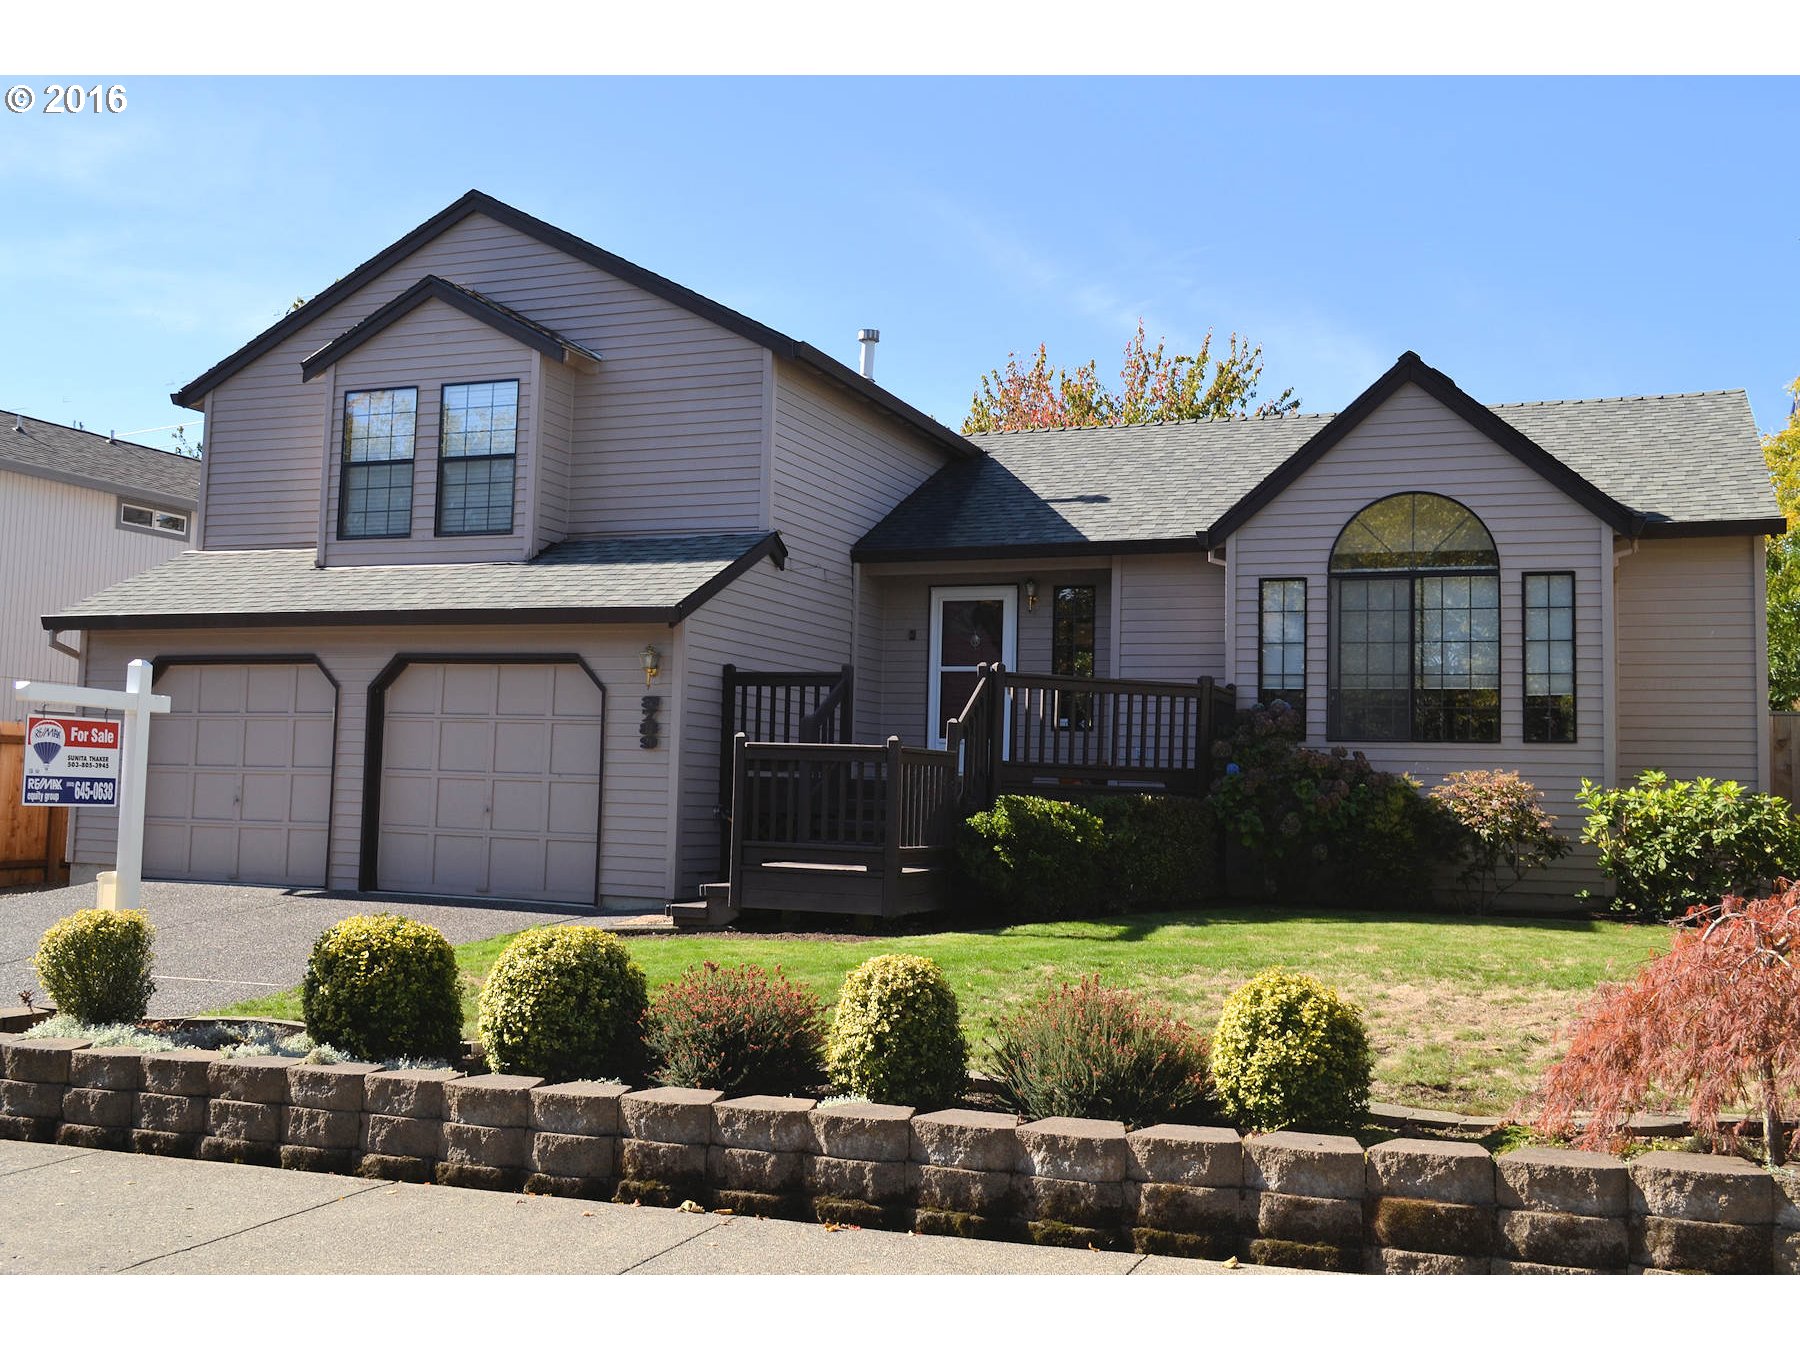
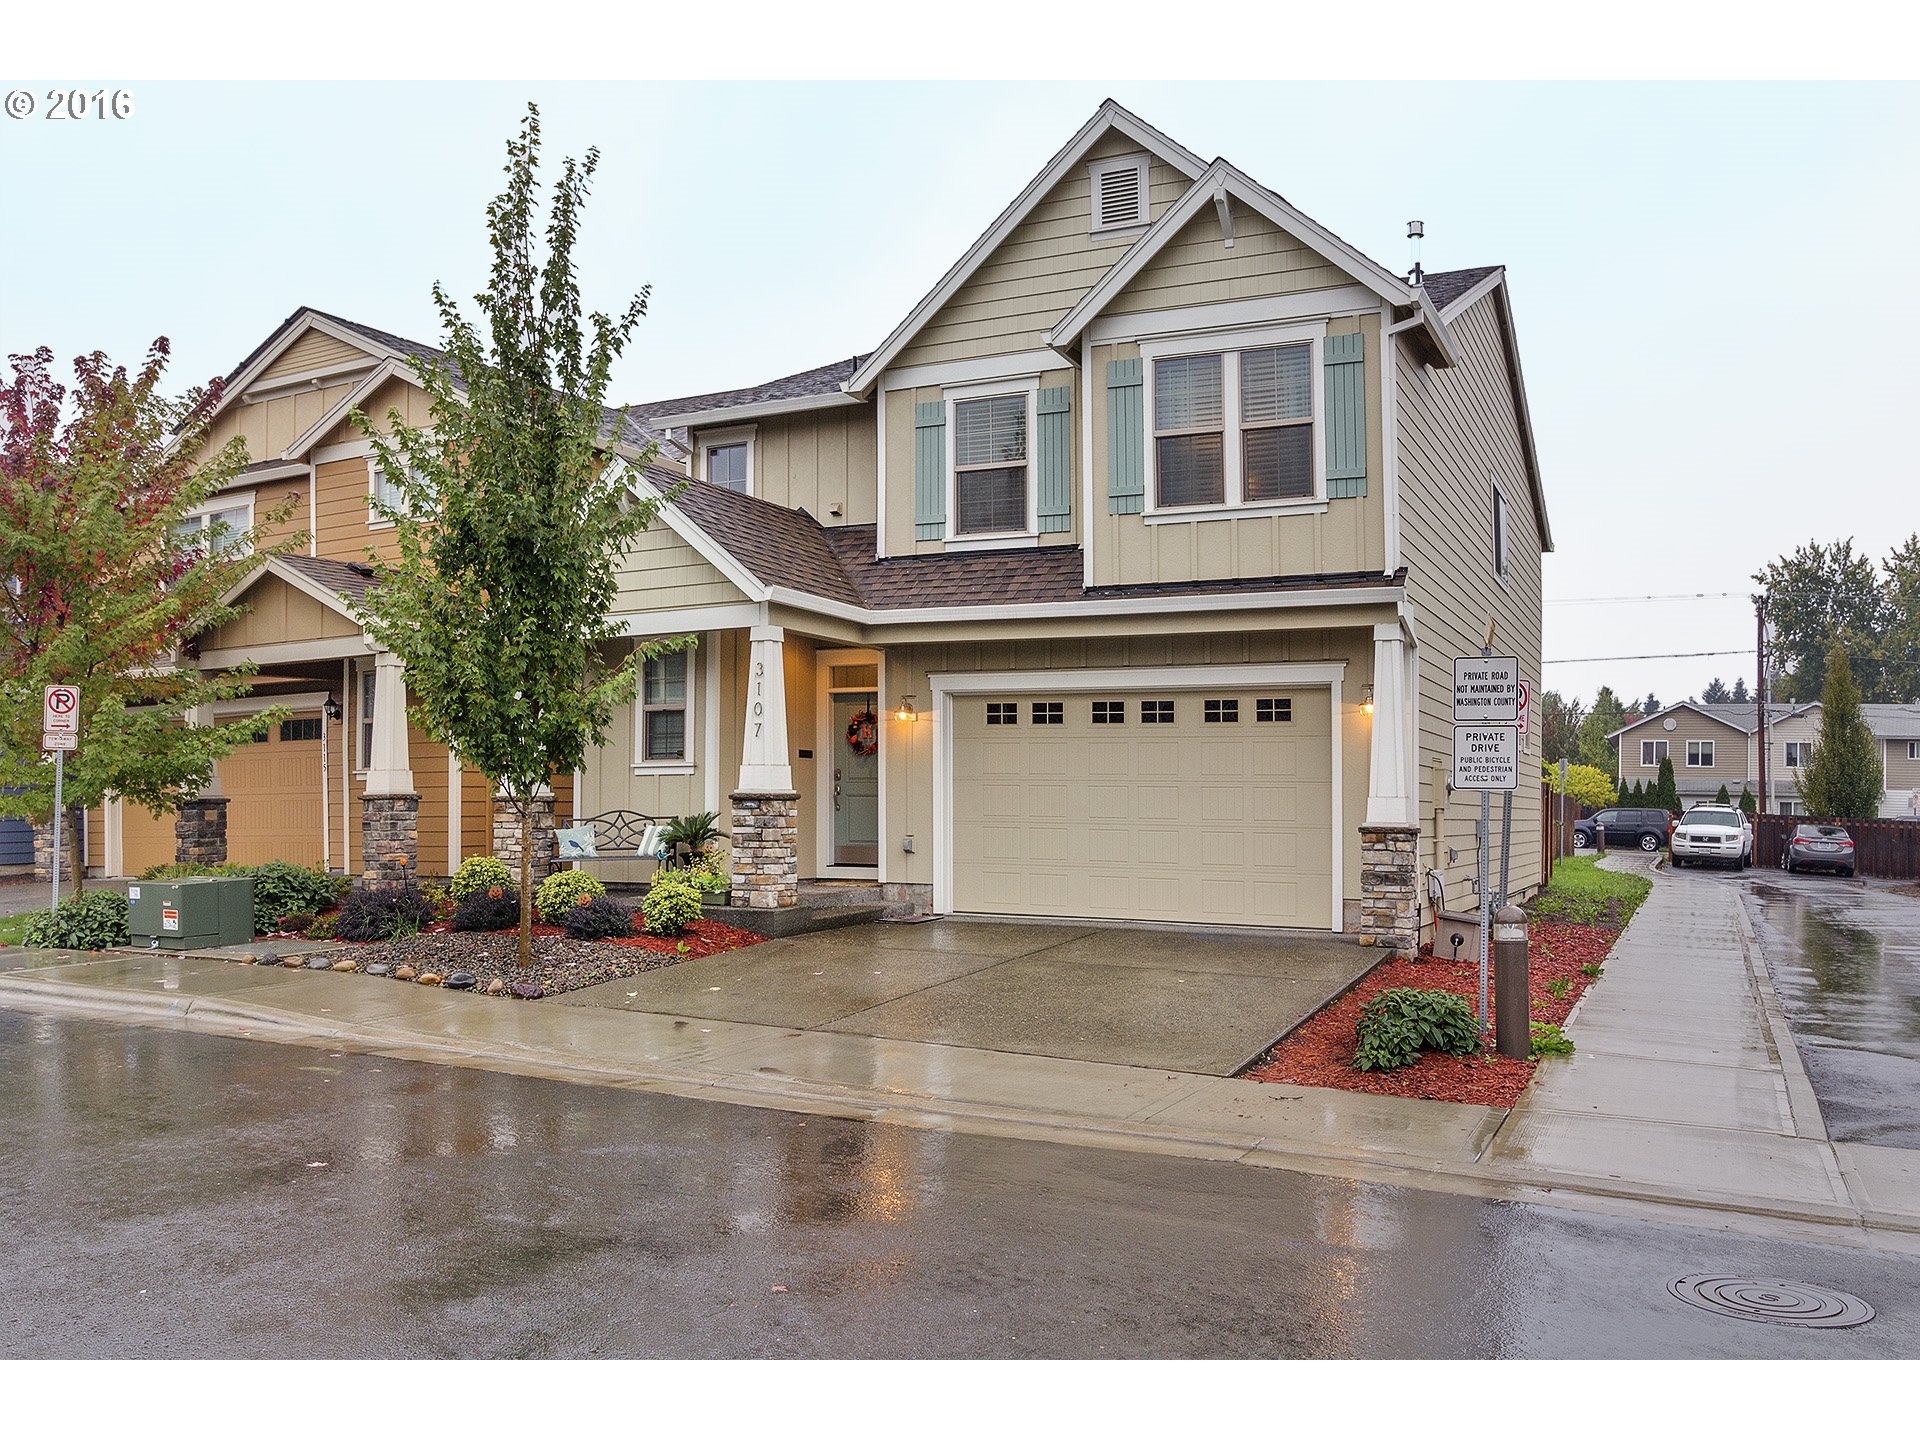
Homes for Sale in Beaverton
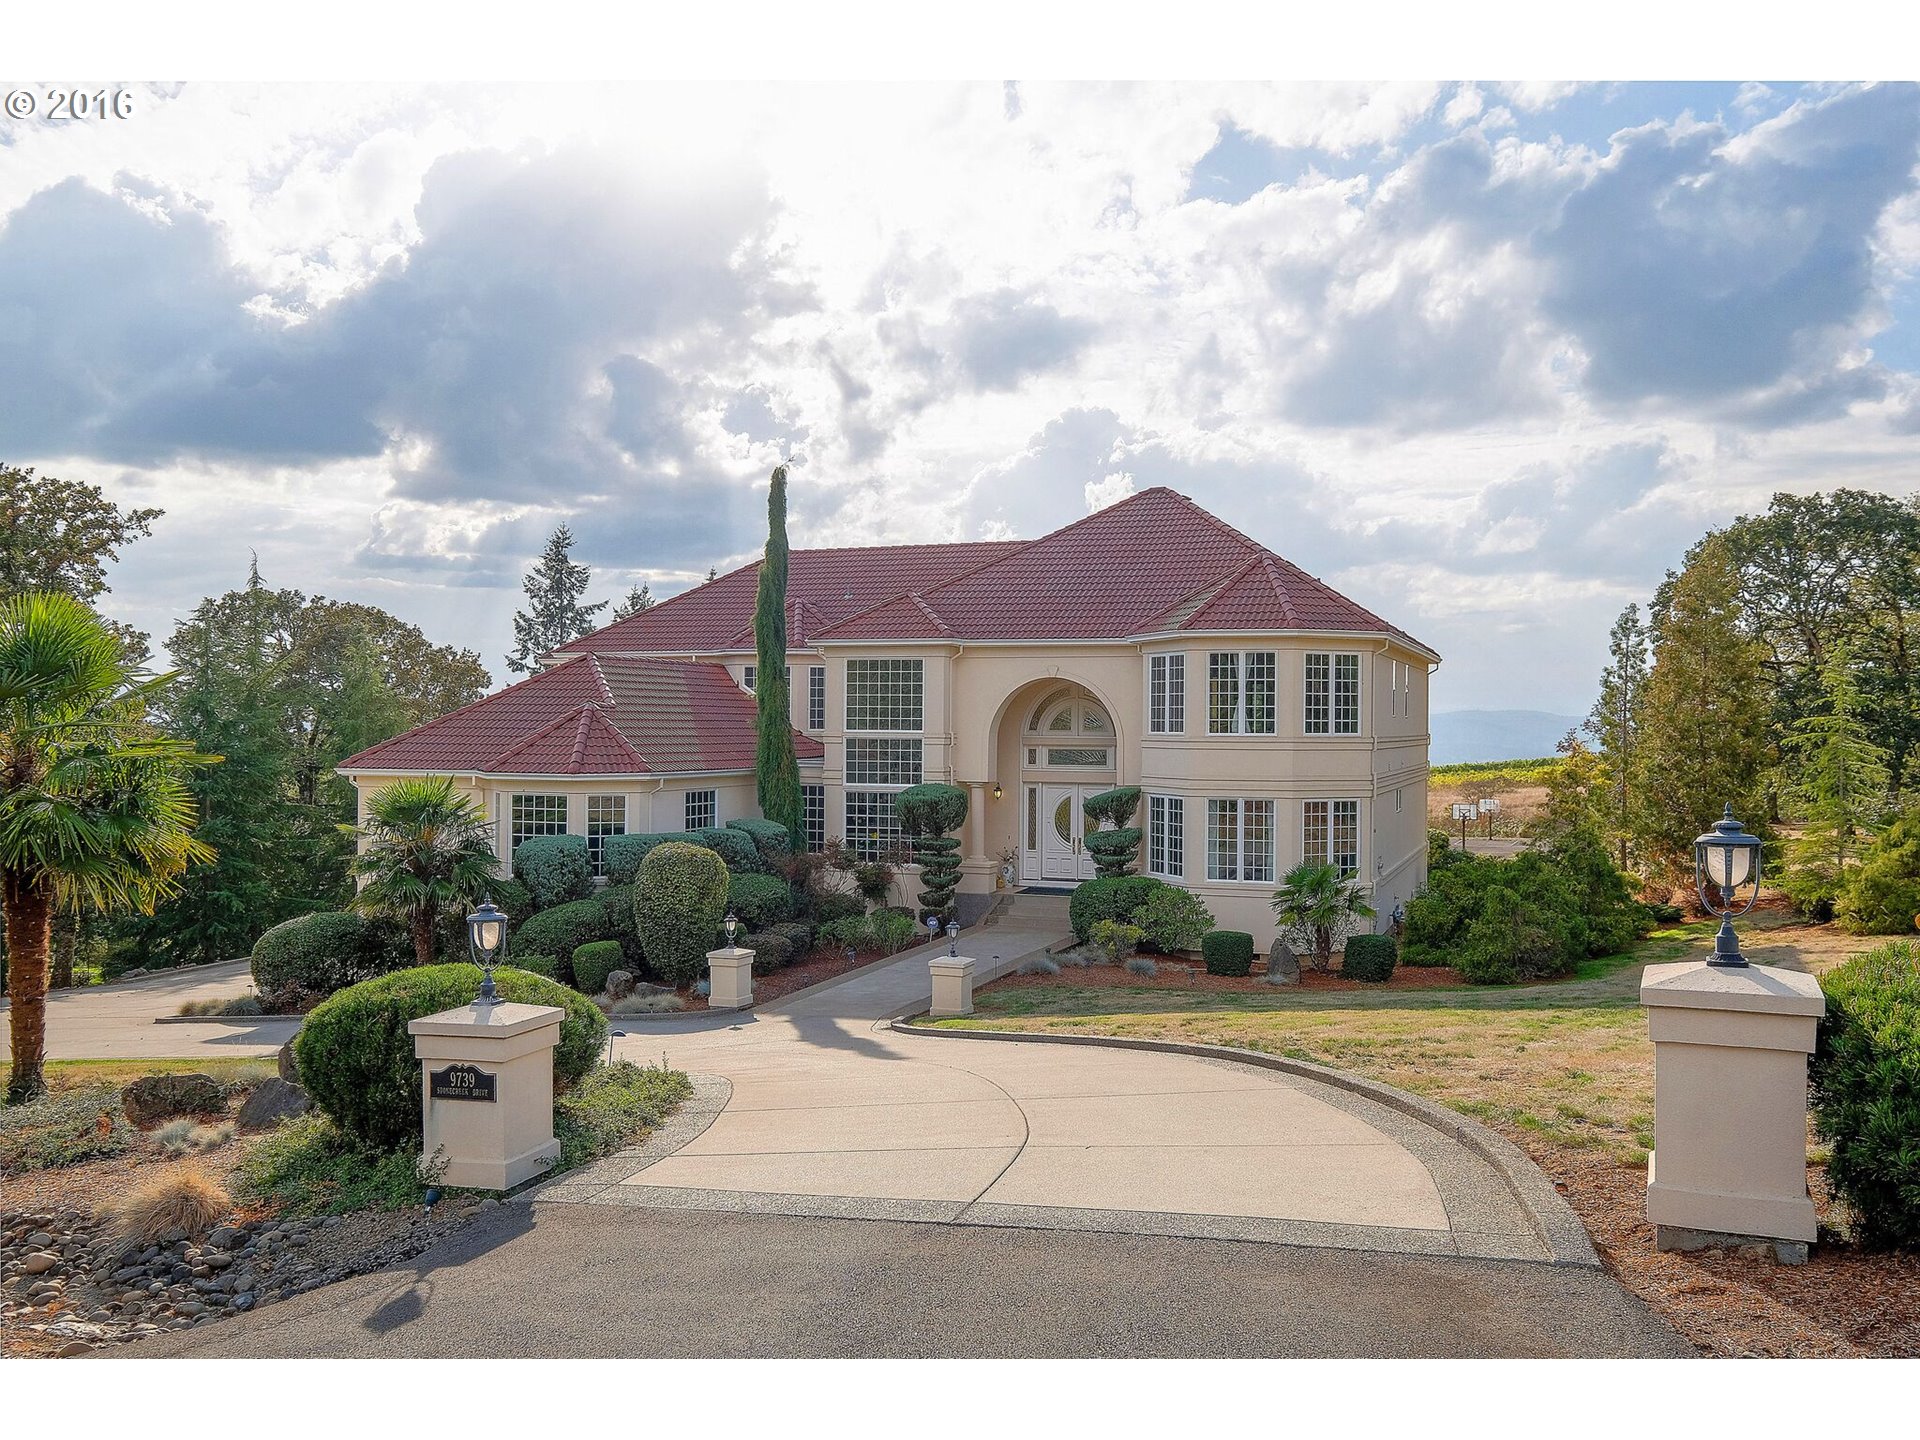
9739 Sw Stonecreek Dr Beaverton, OR 97007
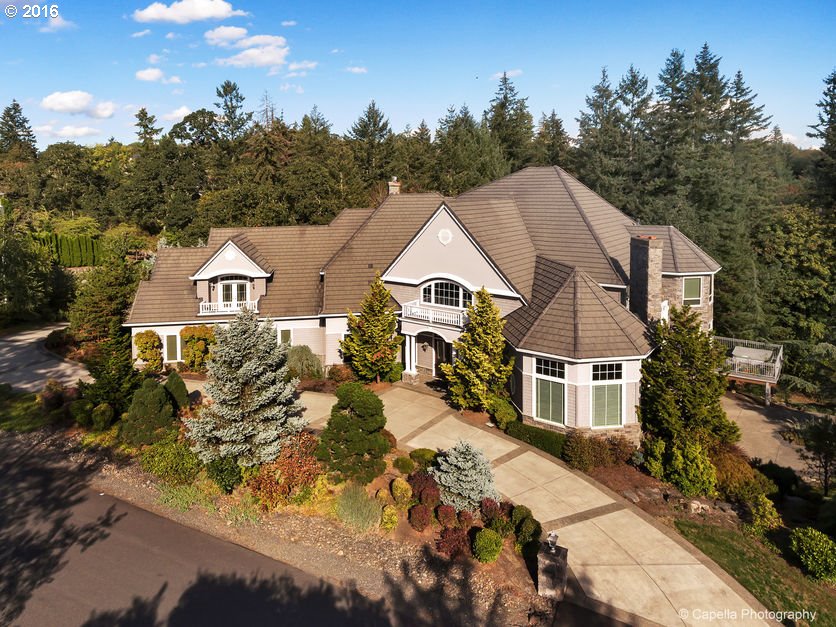
9600 Sw Whispering Fir Dr Beaverton, OR 97007
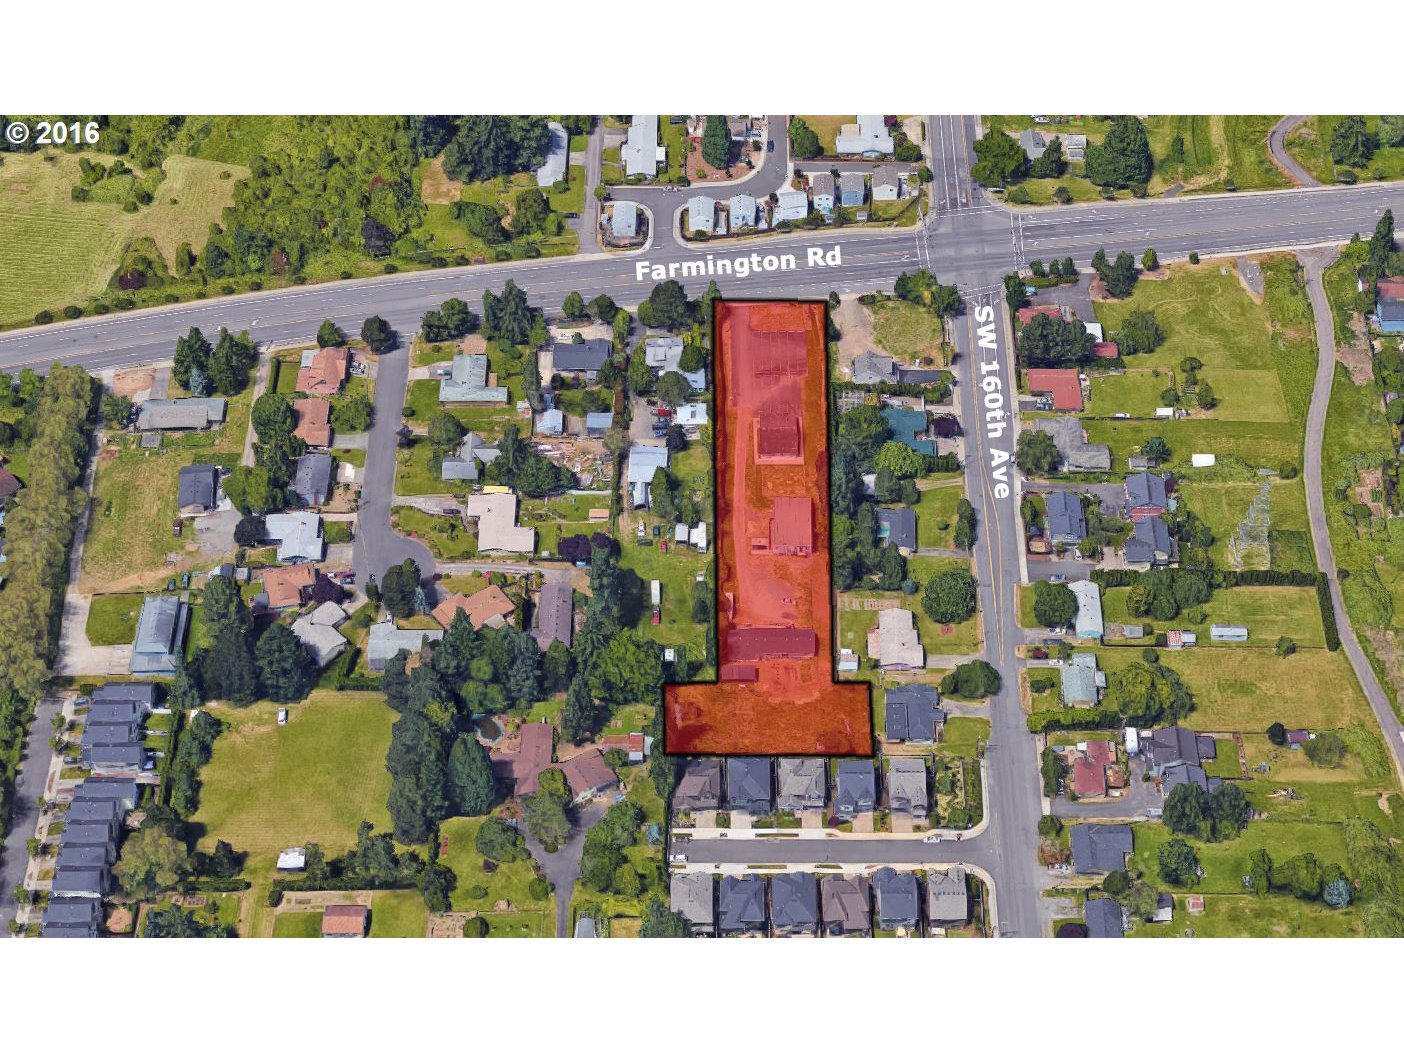
16100 Sw Farmington Rd Beaverton, OR 97007
12365 Sw Mcalpin Pl Beaverton, OR 97007
17941 Sw Cicero Ct Beaverton, OR 97007
17400 Sw Hoodoo Ct Beaverton, OR 97007
7875 Sw Miller Hill Rd Beaverton, OR 97007
15890 Sw Nighthawk Dr Beaverton, OR 97007
21400 Sw Rosedale Rd Beaverton, OR 97078

20351 Sw Tremont Way Beaverton, OR 97007
1505 Sw 192nd Ave Aloha, OR 97003
20103 Sw Tremont Way Beaverton, OR 97007
8653 Sw Muledeer Dr Beaverton, OR 97007
18262 Sw Santoro Dr Beaverton, OR 97007

16650 Sw Red Rock Way Beaverton, OR 97007

19075 Nw Walker Rd Beaverton, OR 97006
8700 Sw Amicus Ter Beaverton, OR 97007
8659 Sw Muledeer Dr Beaverton, OR 97007
16560 Sw Red Rock Way Beaverton, OR 97007
9725 Sw 168th Pl Beaverton, OR 97007
19653 Sw Hunter Ln Beaverton, OR 97007
5150 Sw 209th Ave Beaverton, OR 97078
9206 Sw 169th Ave Beaverton, OR 97007
10959 Sw Lindenwold Ct Beaverton, OR 97005
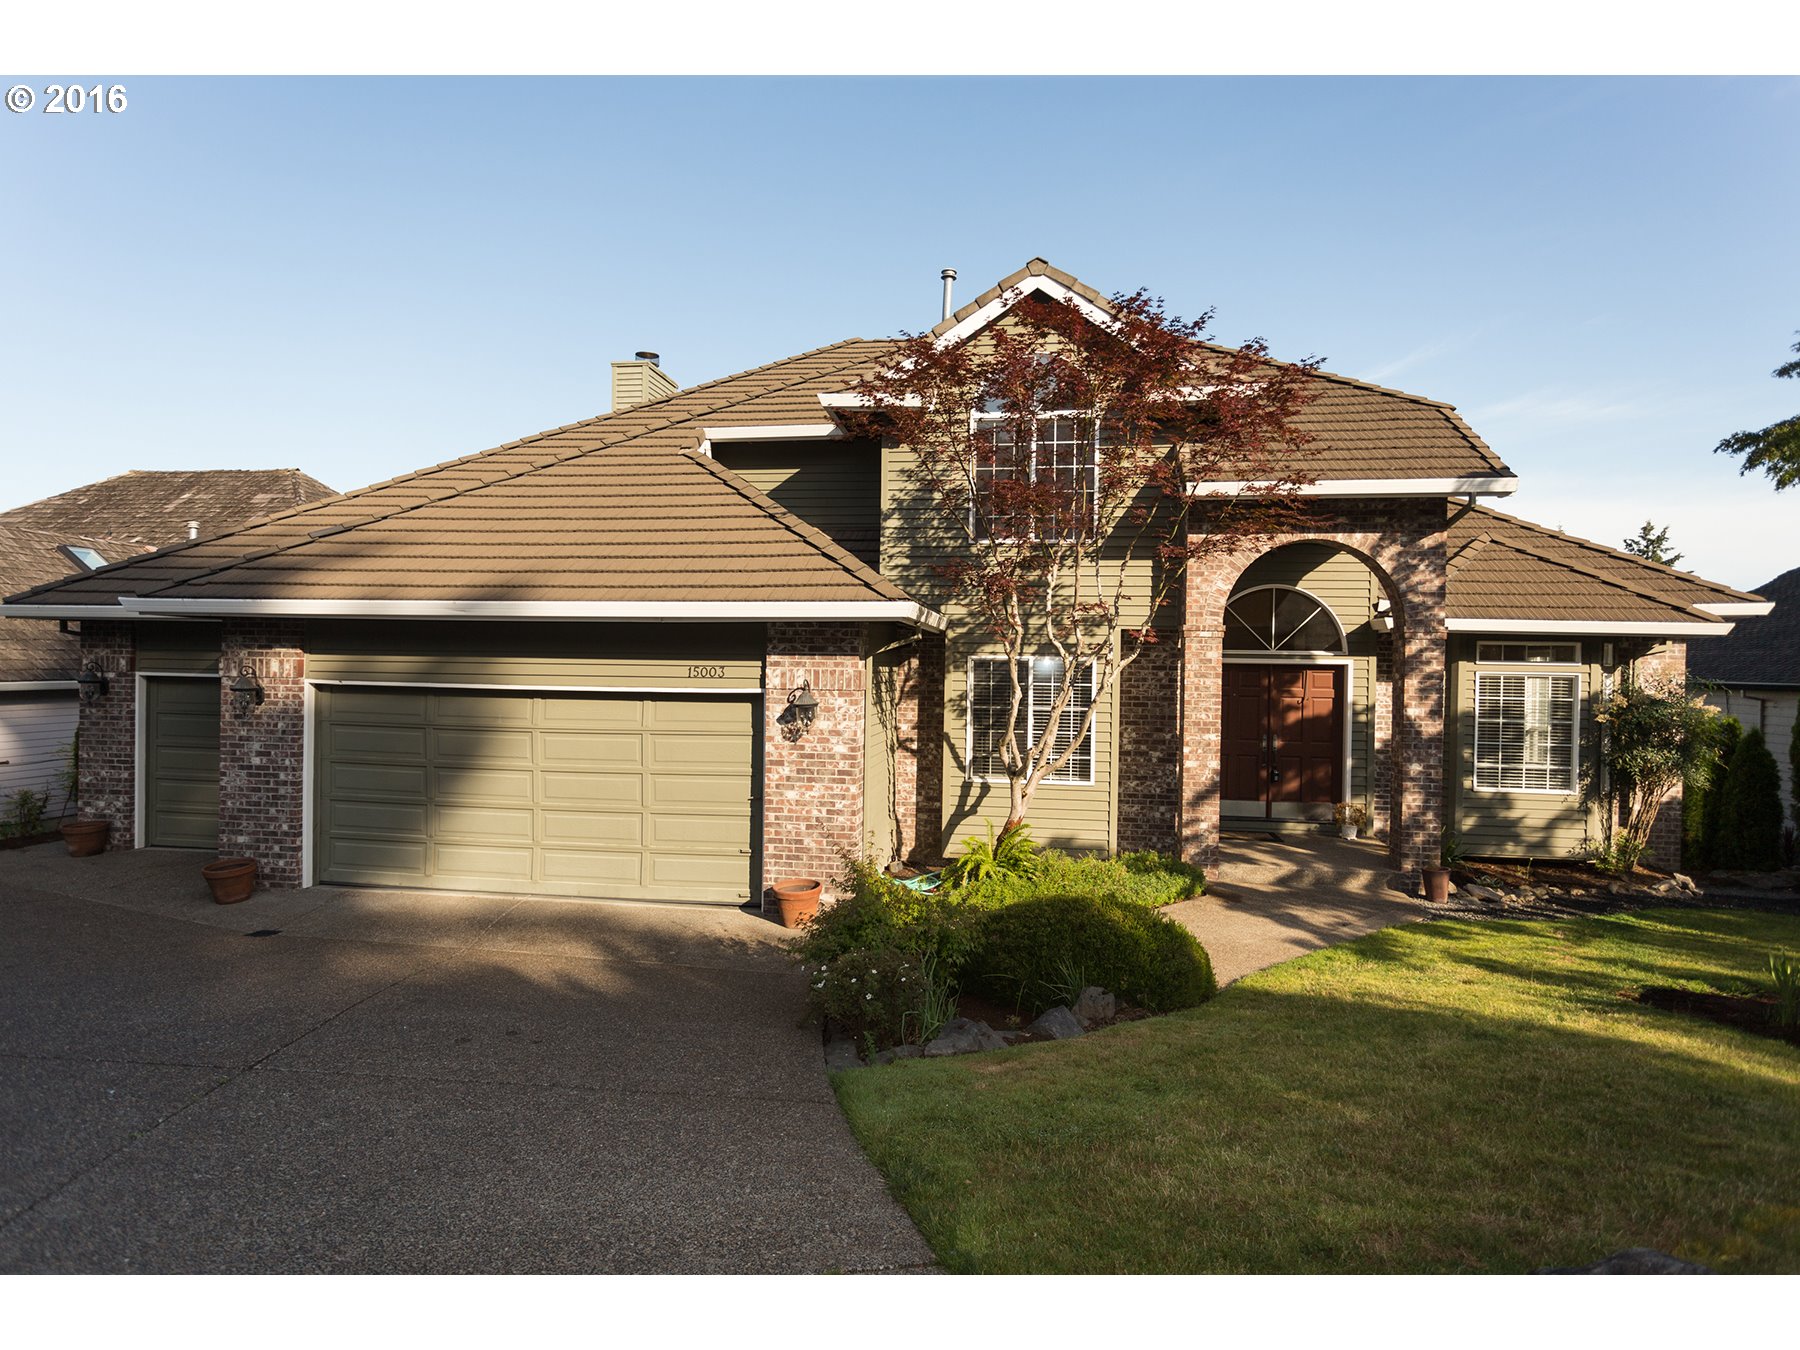
15003 Sw Telluride Ter Beaverton, OR 97007
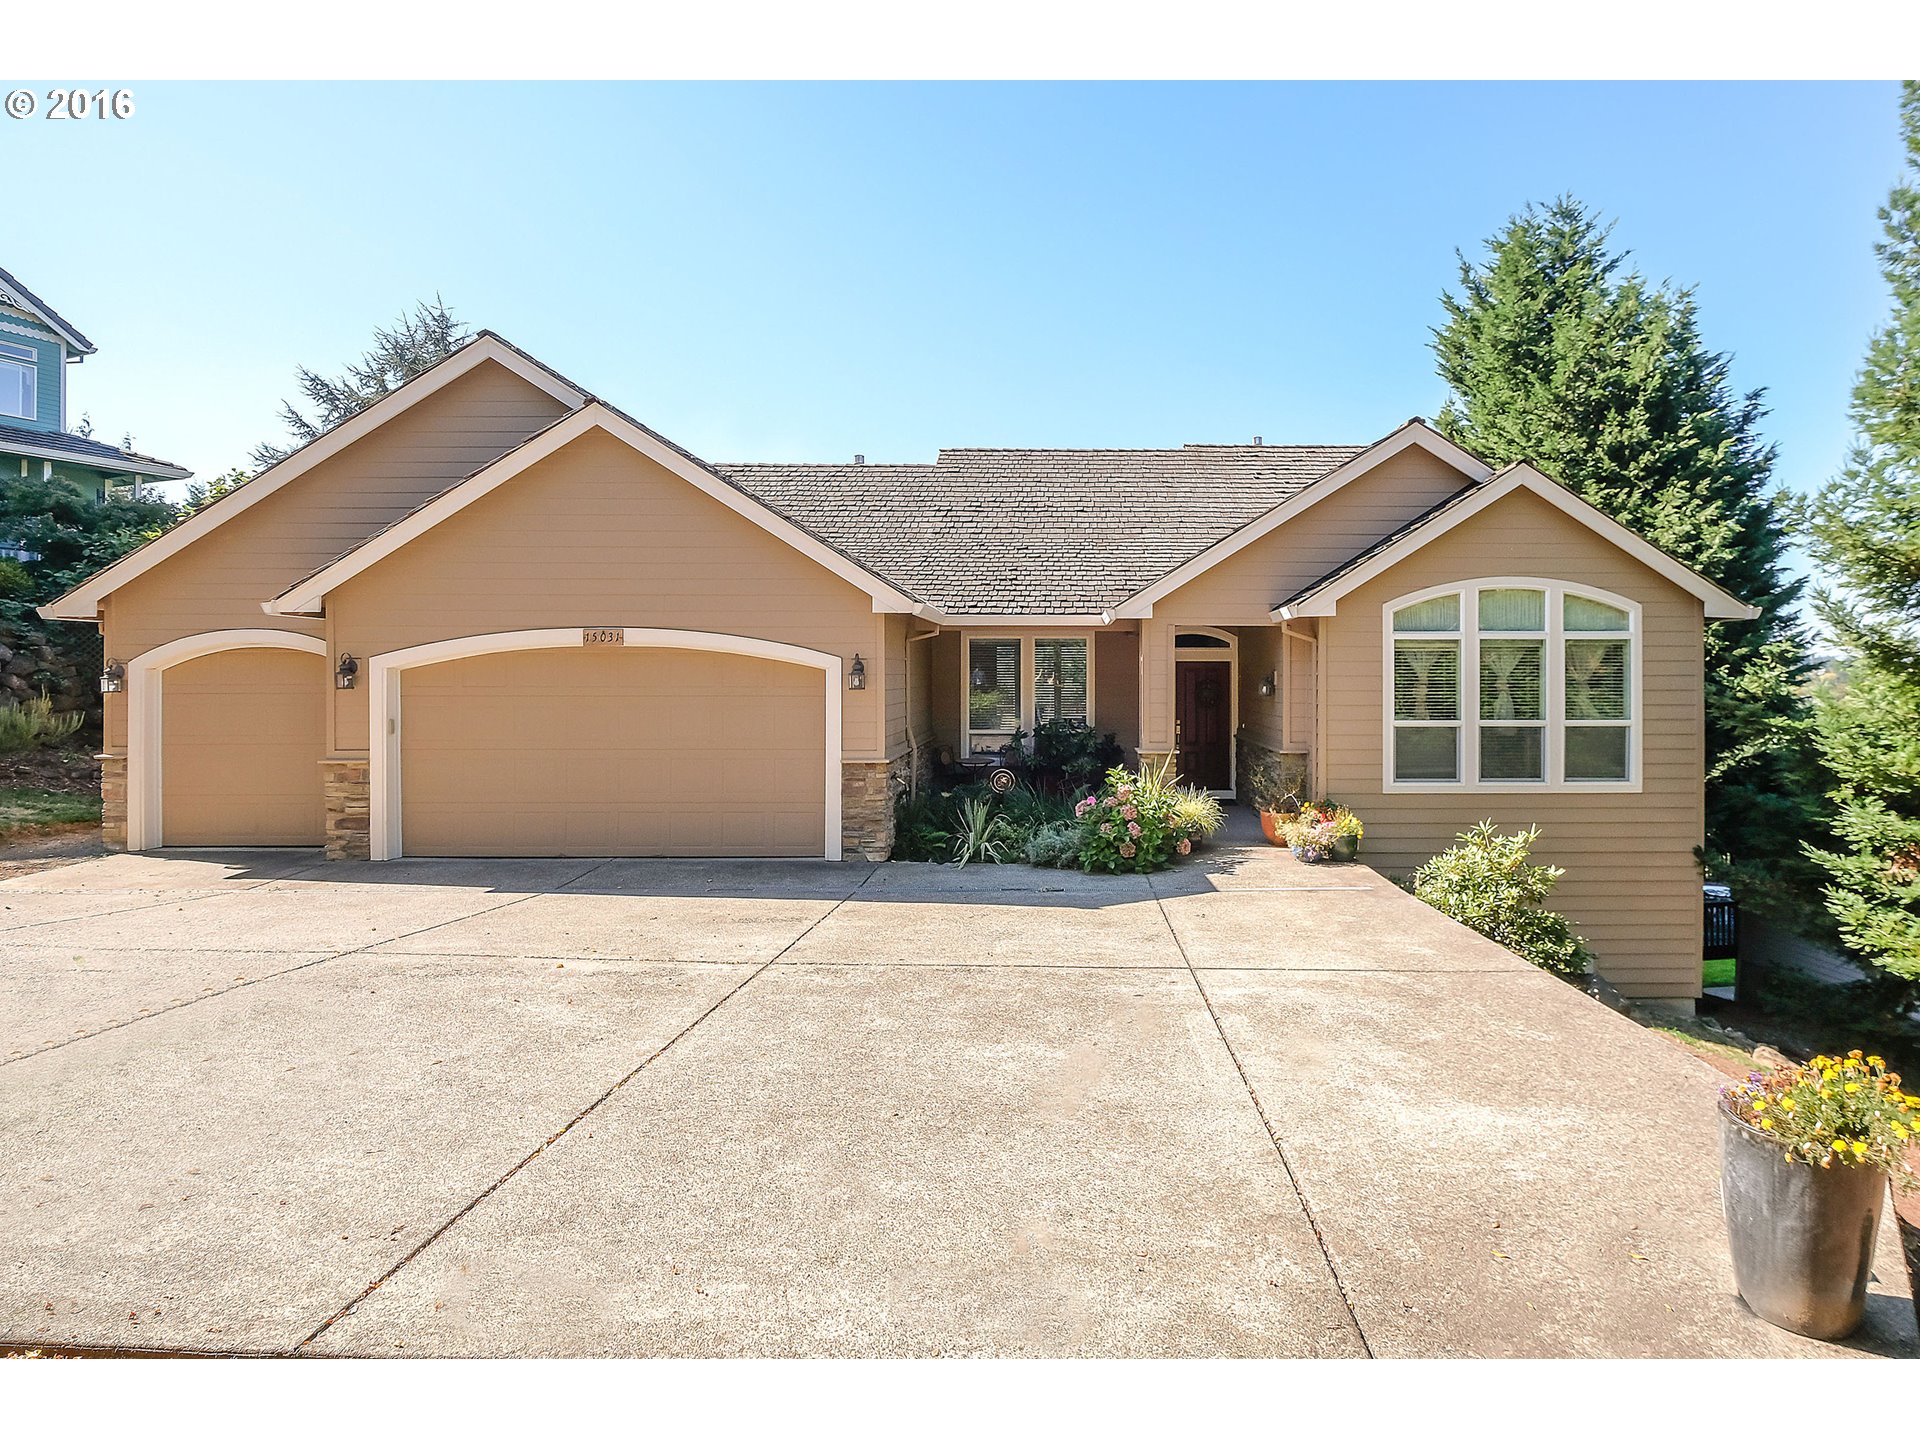
15031 Sw Telluride Ct Beaverton, OR 97007
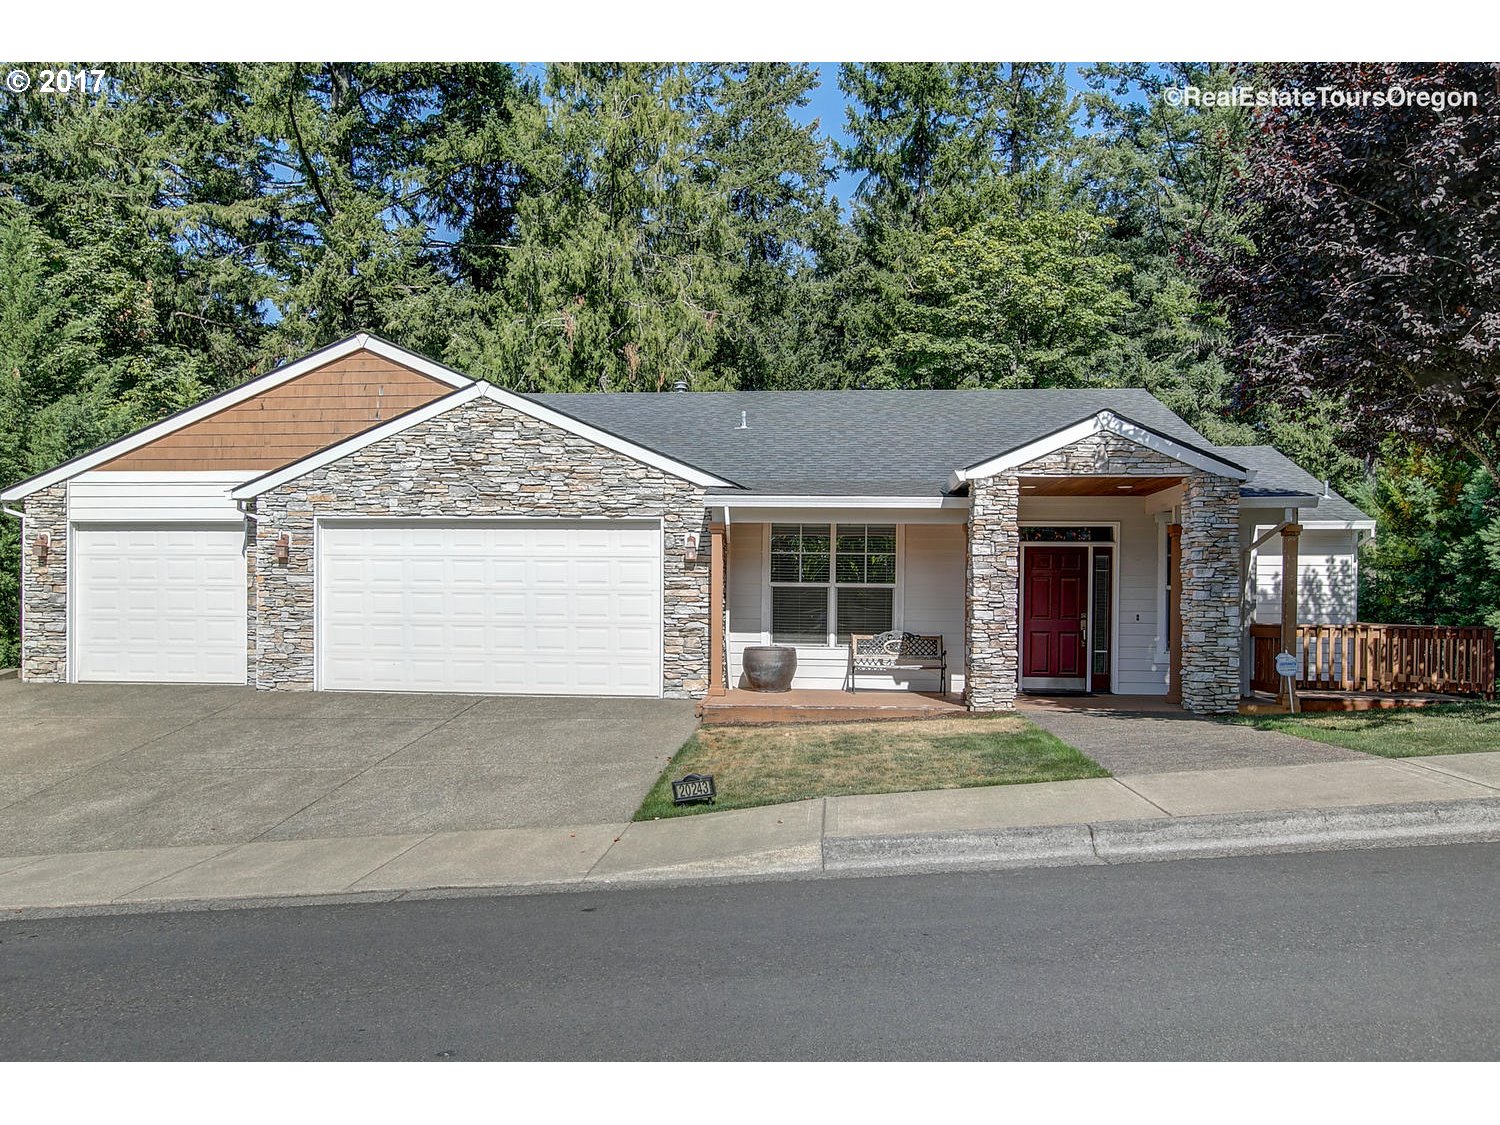
20243 Sw Tremont Way Beaverton, OR 97007
8847 Sw Ravine Dr Beaverton, OR 97007

15900 Sw Breccia Dr Beaverton, OR 97007
10927 Sw Lindenwold Ct Beaverton, OR 97005
1240 Sw 201st Ave Aloha, OR 97003
9665 Sw 163rd Ave Beaverton, OR 97007
8985 Sw 190th Ave Aloha, OR 97007
8415 Sw 175th Ave Beaverton, OR 97007
17012 Sw Nafus Ln Beaverton, OR 97007
18900 Sw Johnson St Aloha, OR 97003
8041 Sw 199th Ave Beaverton, OR 97007

9270 Sw Oregon Jade Ter Beaverton, OR 97007
2420 Sw 192nd Ave Aloha, OR 97003

2420 Sw 192nd Ave Aloha, OR 97003
9080 Sw 180th Pl Beaverton, OR 97007
15550 Sw Cynthia Ln Beaverton, OR 97007

355 Sw 167th Ave Beaverton, OR 97006
9720 Sw 160th Ave Beaverton, OR 97007
7752 Sw Charles Ter Beaverton, OR 97007
16685 Sw Oregon Jade Ct Beaverton, OR 97007
16245 Sw Jade View Way Beaverton, OR 97007
17720 Sw Rigert Rd Beaverton, OR 97007
20363 Sw Cassandra Ln Beaverton, OR 97007

10885 Sw Falcon Ct Beaverton, OR 97007
19859 Sw Sonia Ln Beaverton, OR 97007
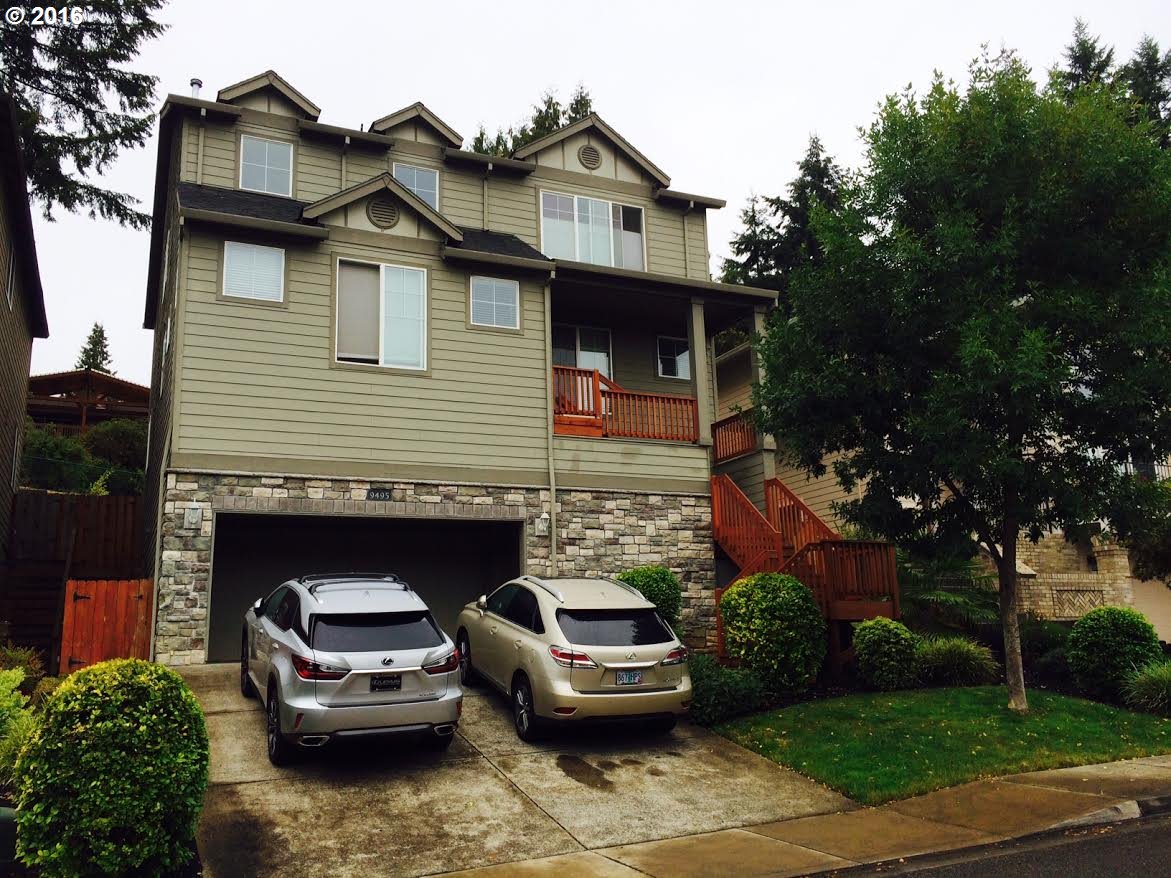
9495 Sw 165th Ave Beaverton, OR 97007
7766 Sw Bayberry Dr Beaverton, OR 97007

15535 Nw Norwich St Beaverton, OR 97006
8185 Sw Liz Pl Aloha, OR 97007
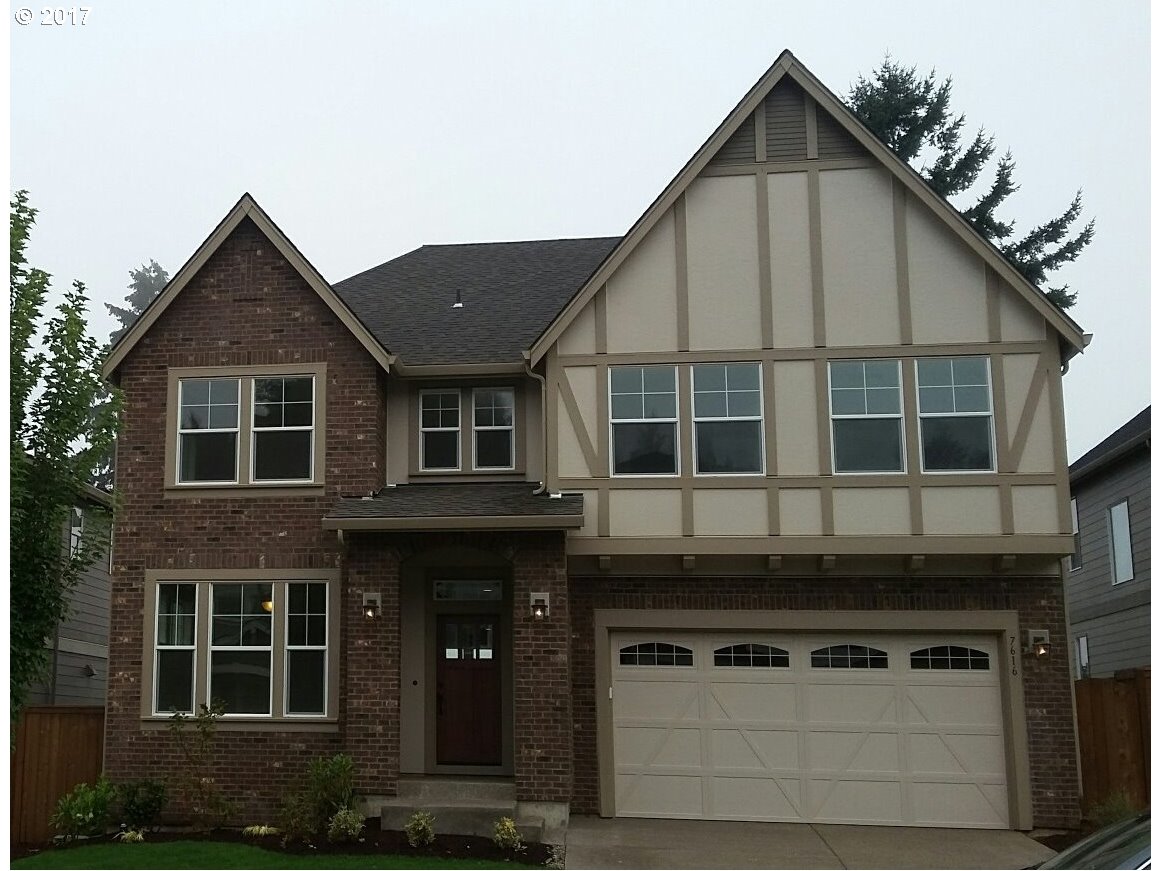
7616 Sw Applegate Dr Beaverton, OR 97007
8634 Sw Muledeer Dr Beaverton, OR 97007
6948 Sw Tierra Del Mar Dr Beaverton, OR 97007
9085 Sw 182nd Ave Beaverton, OR 97007
7572 Sw Millerglen Dr Beaverton, OR 97007
15695 Sw Bobwhite Cir Beaverton, OR 97007
9465 Sw Moonstone Ter Beaverton, OR 97007
20150 Sw Jette Ln Beaverton, OR 97003
20333 Sw Navarre Ln Beaverton, OR 97007
16495 Sw Emerald View St Beaverton, OR 97007
15535 Sw Cynthia Ln Beaverton, OR 97007
8660 Sw Turquoise Loop Beaverton, OR 97007
18894 Sw Kelly View Loop Beaverton, OR 97007
9485 Sw 160th Ave Beaverton, OR 97007
10070 Sw 151st Pl Beaverton, OR 97007
13940 Sw Secretariet Ln Beaverton, OR 97008

6405 Sw 209th Ave Beaverton, OR 97078
15910 Nw Foxborough Cir Beaverton, OR 97006

18020 Sw Pheasant Ct Aloha, OR 97003
13872 Sw Bonnie Brae Ct Beaverton, OR 97005
13915 Sw Secretariet Ln Beaverton, OR 97008
20841 Sw Vicki Ln Beaverton, OR 97007
18700 Sw Hart Rd Beaverton, OR 97007
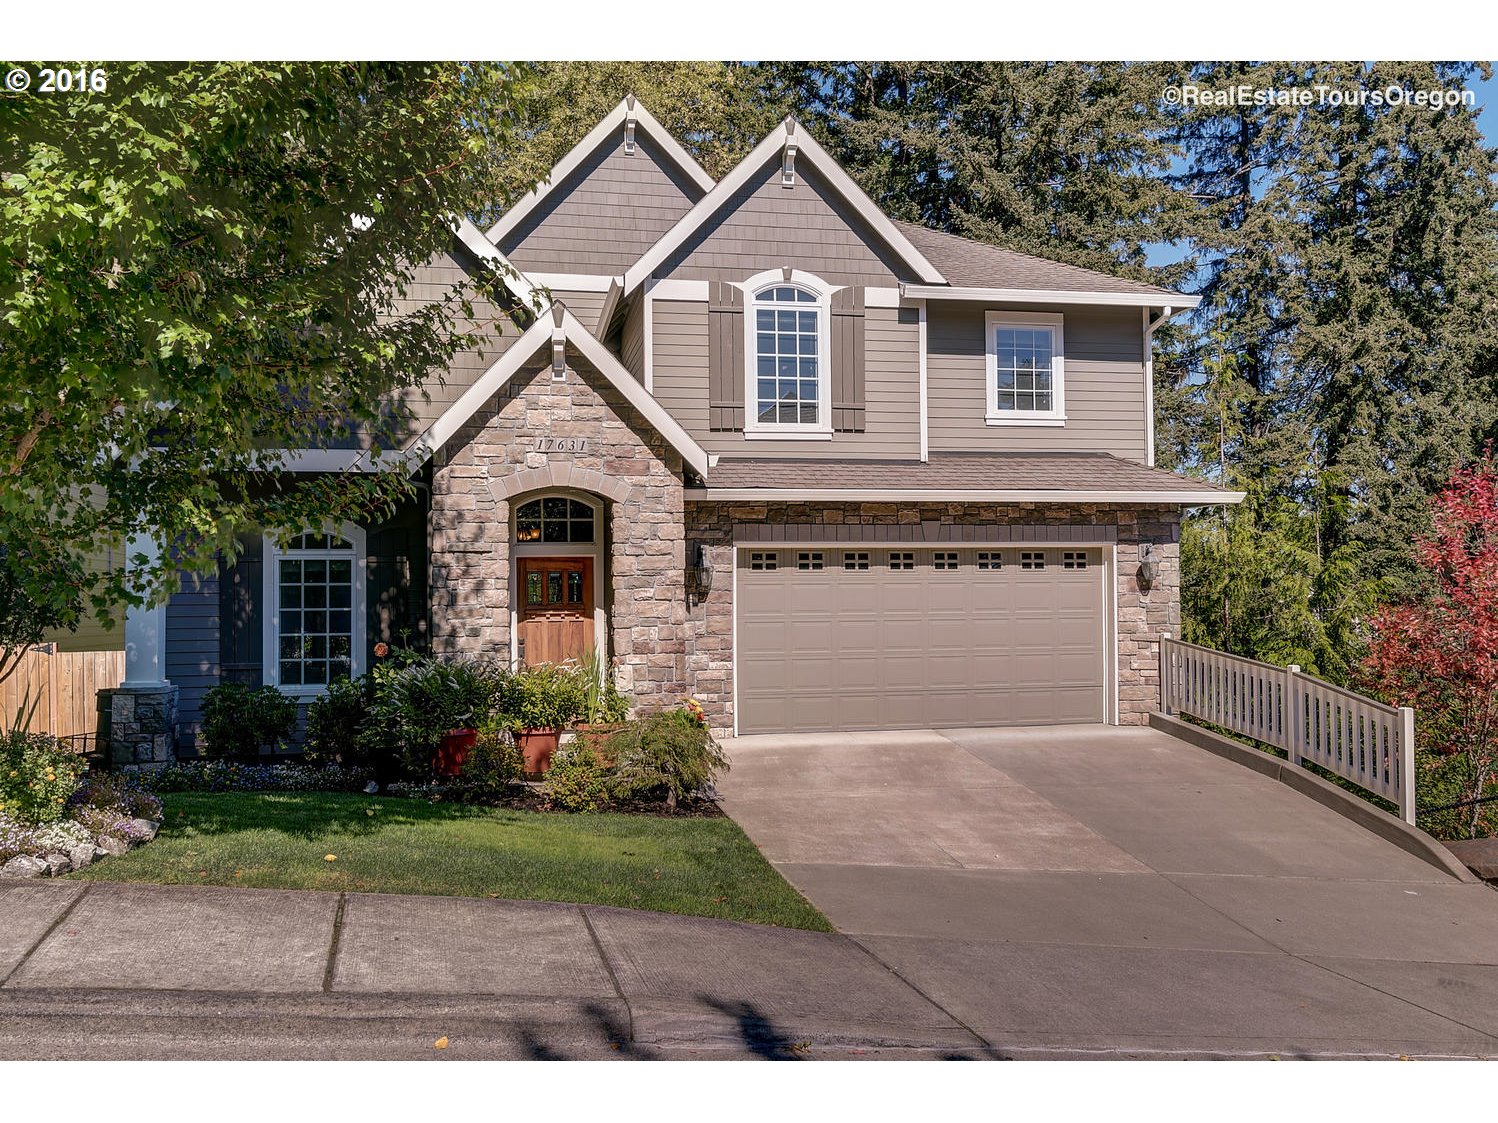
17631 Sw Oviatt St Beaverton, OR 97007
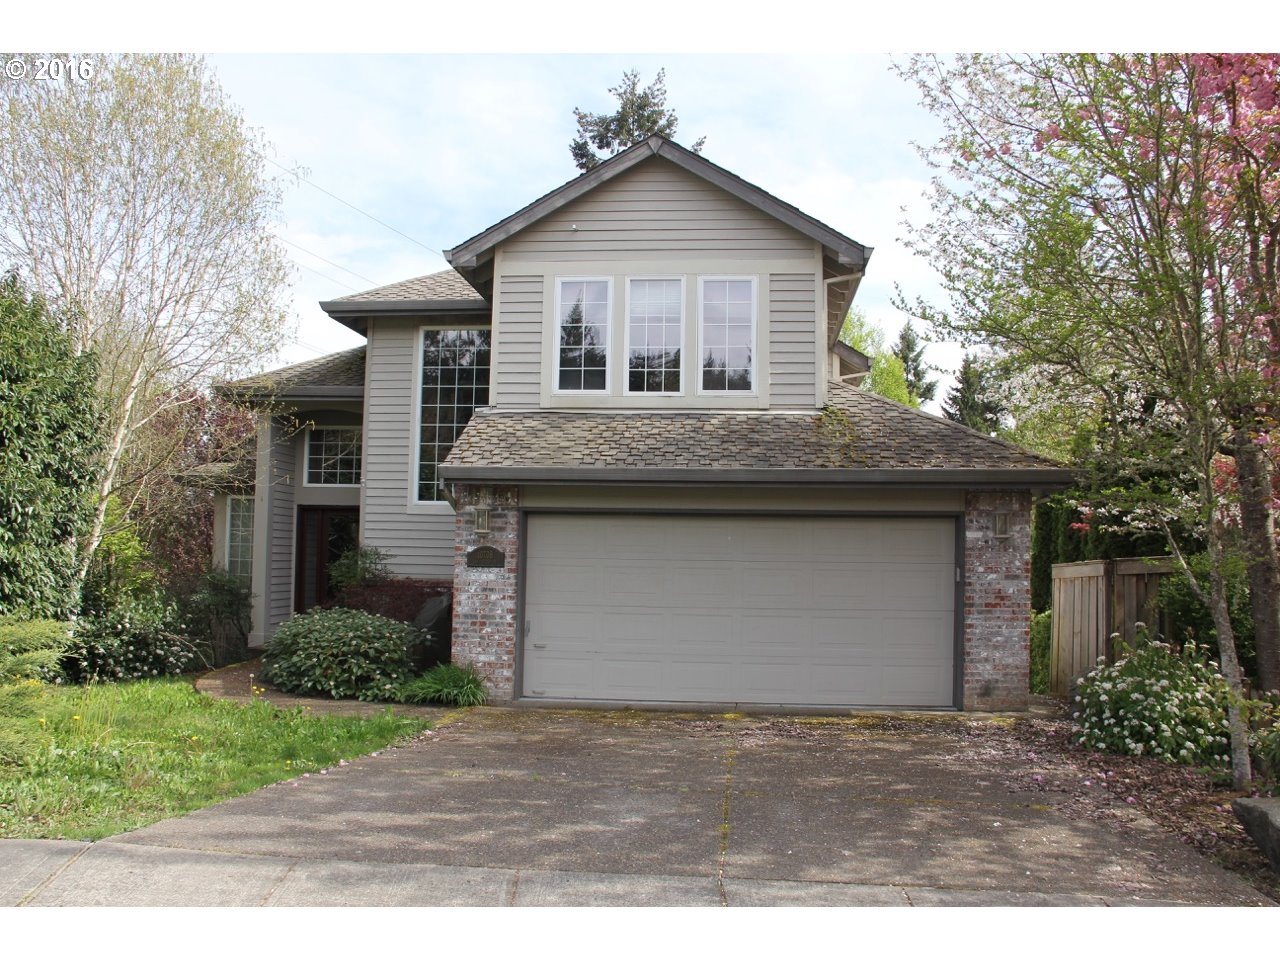
10708 Sw Oriole Cir Beaverton, OR 97007
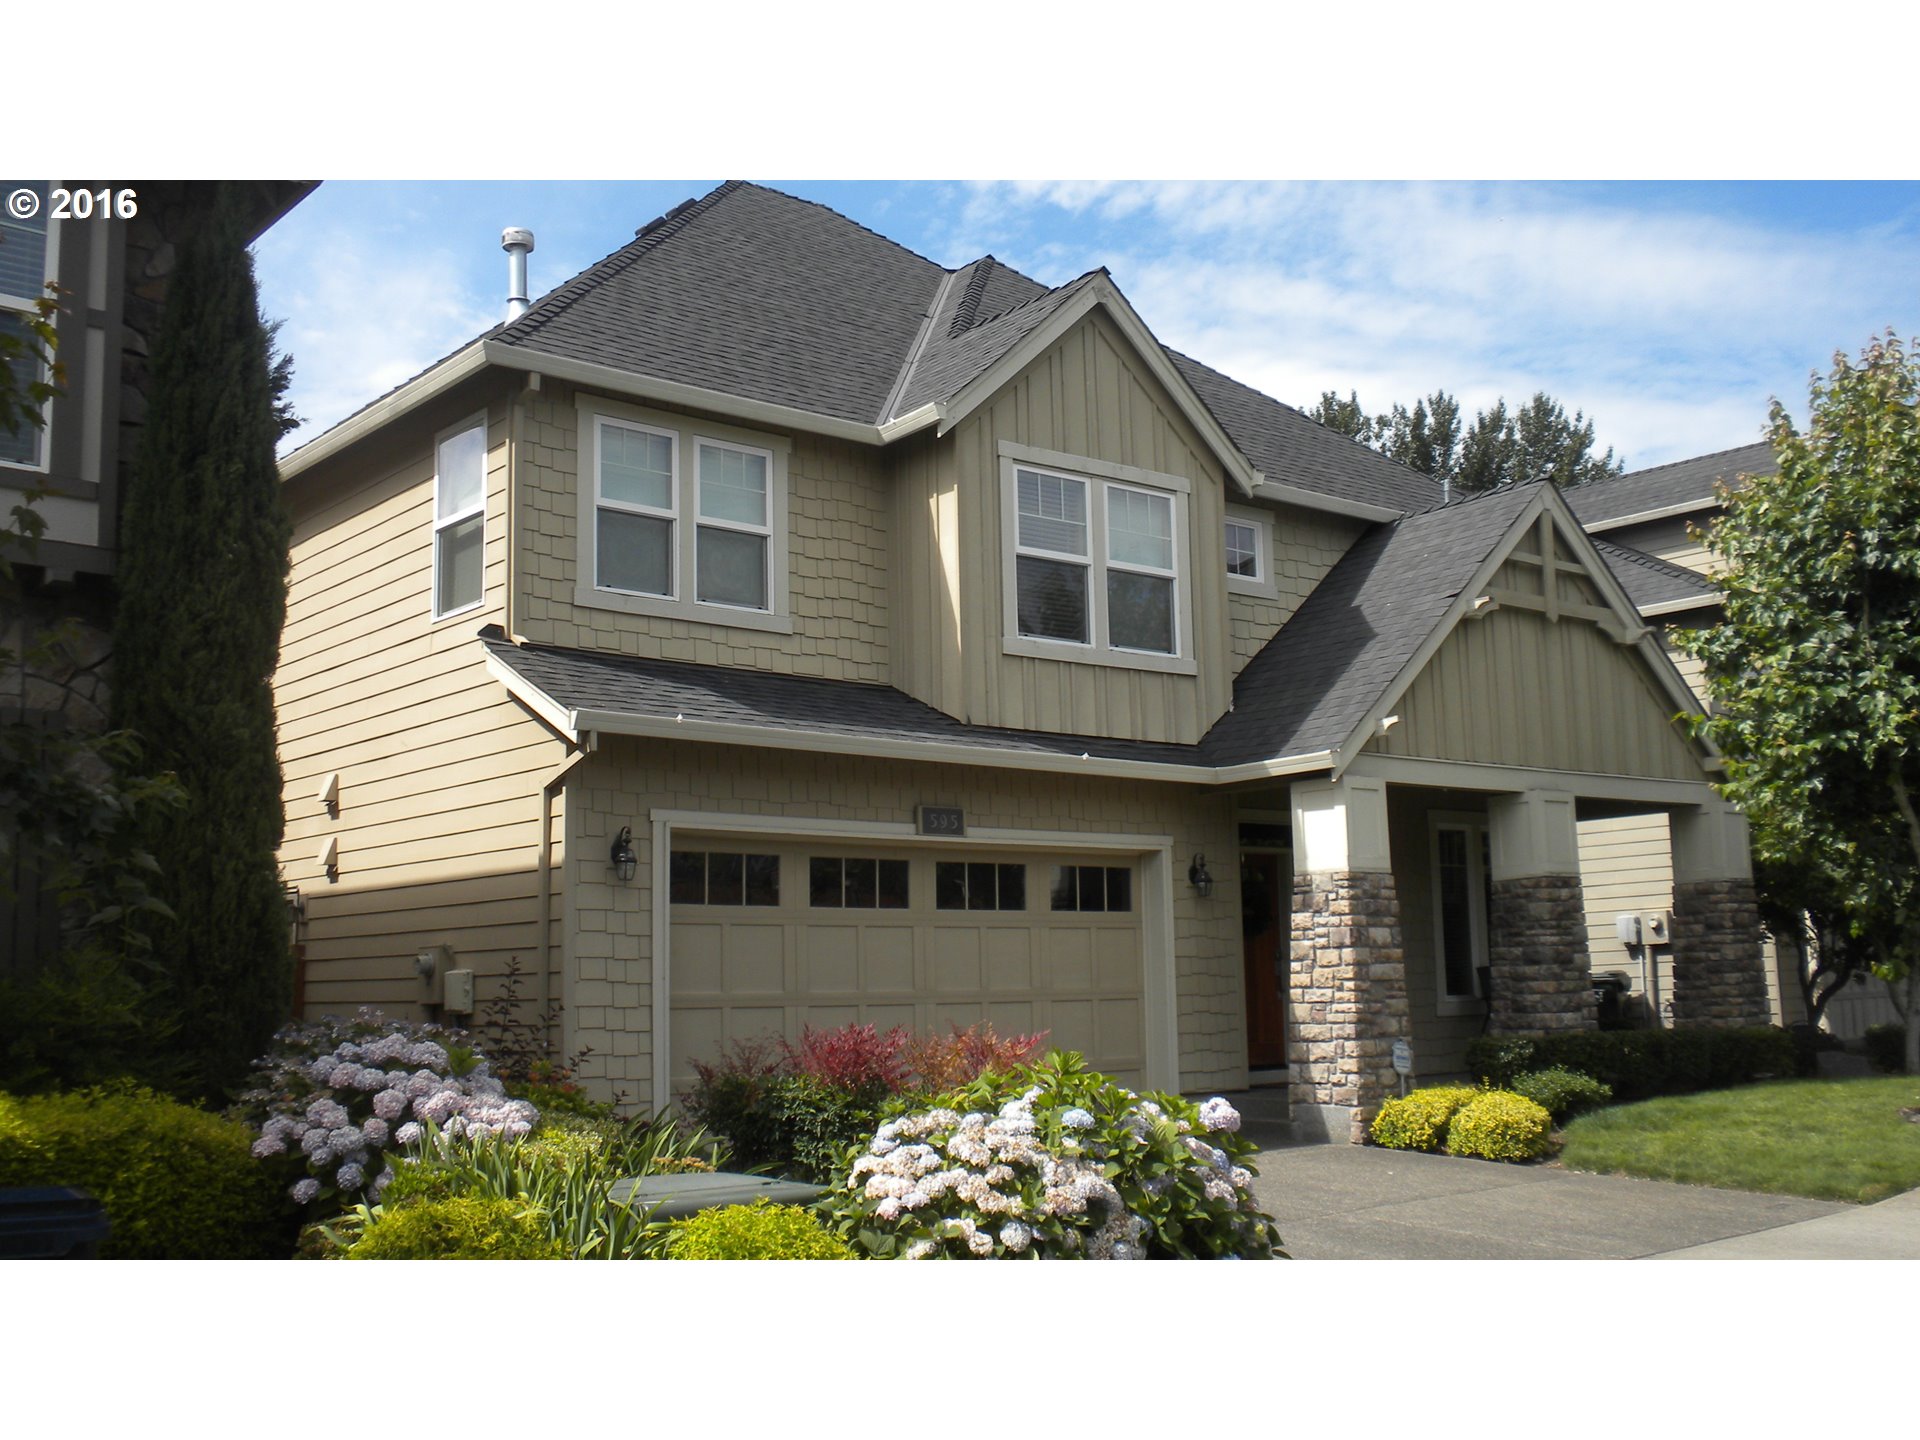
595 Nw Cambray Pl Beaverton, OR 97006
7787 Sw Barnard Dr Beaverton, OR 97007

7515 Sw 205th Ter Beaverton, OR 97007

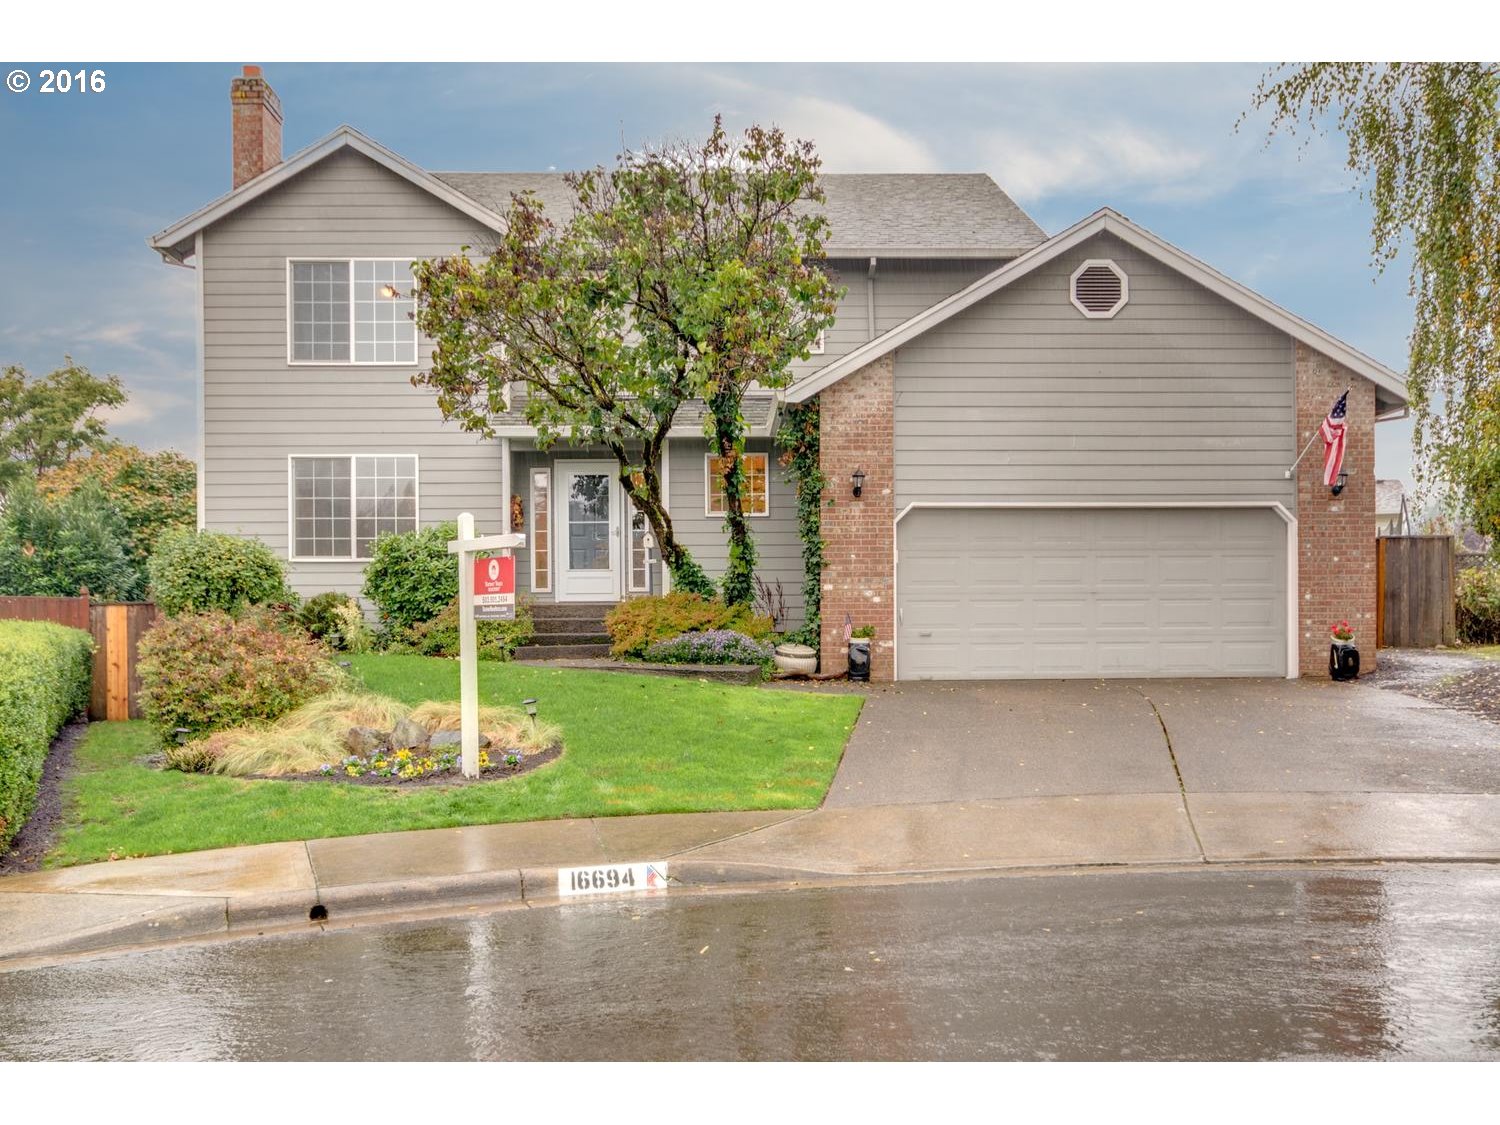
16694 Sw Canseco Ct Beaverton, OR 97007
16290 Nw Bronson Rd Beaverton, OR 97006
19646 Sw Cooperhawk Ct Beaverton, OR 97007
4972 Sw 157th Pl Beaverton, OR 97007

13085 Sw Heather Ct Beaverton, OR 97008
16295 Nw Paisley Dr Beaverton, OR 97006
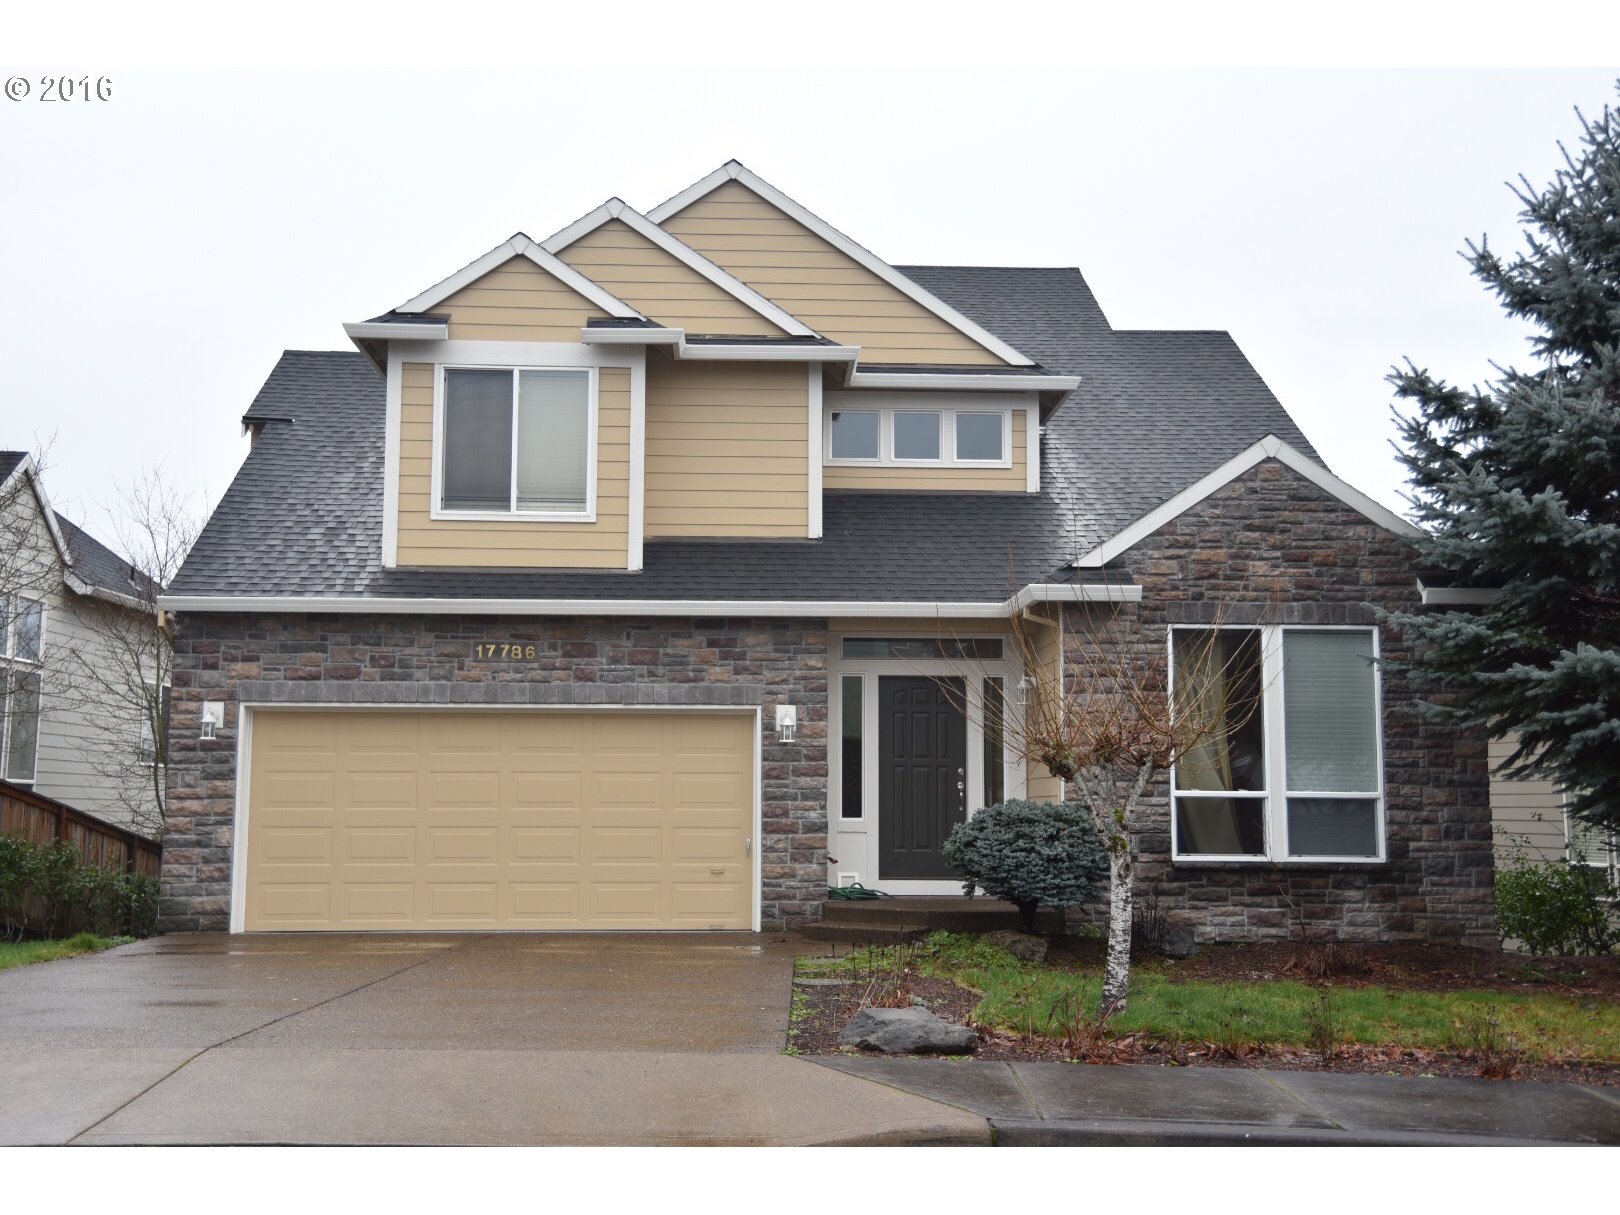
17786 Nw Pioneer Rd Beaverton, OR 97006
16066 Sw Waxwing Way Beaverton, OR 97007

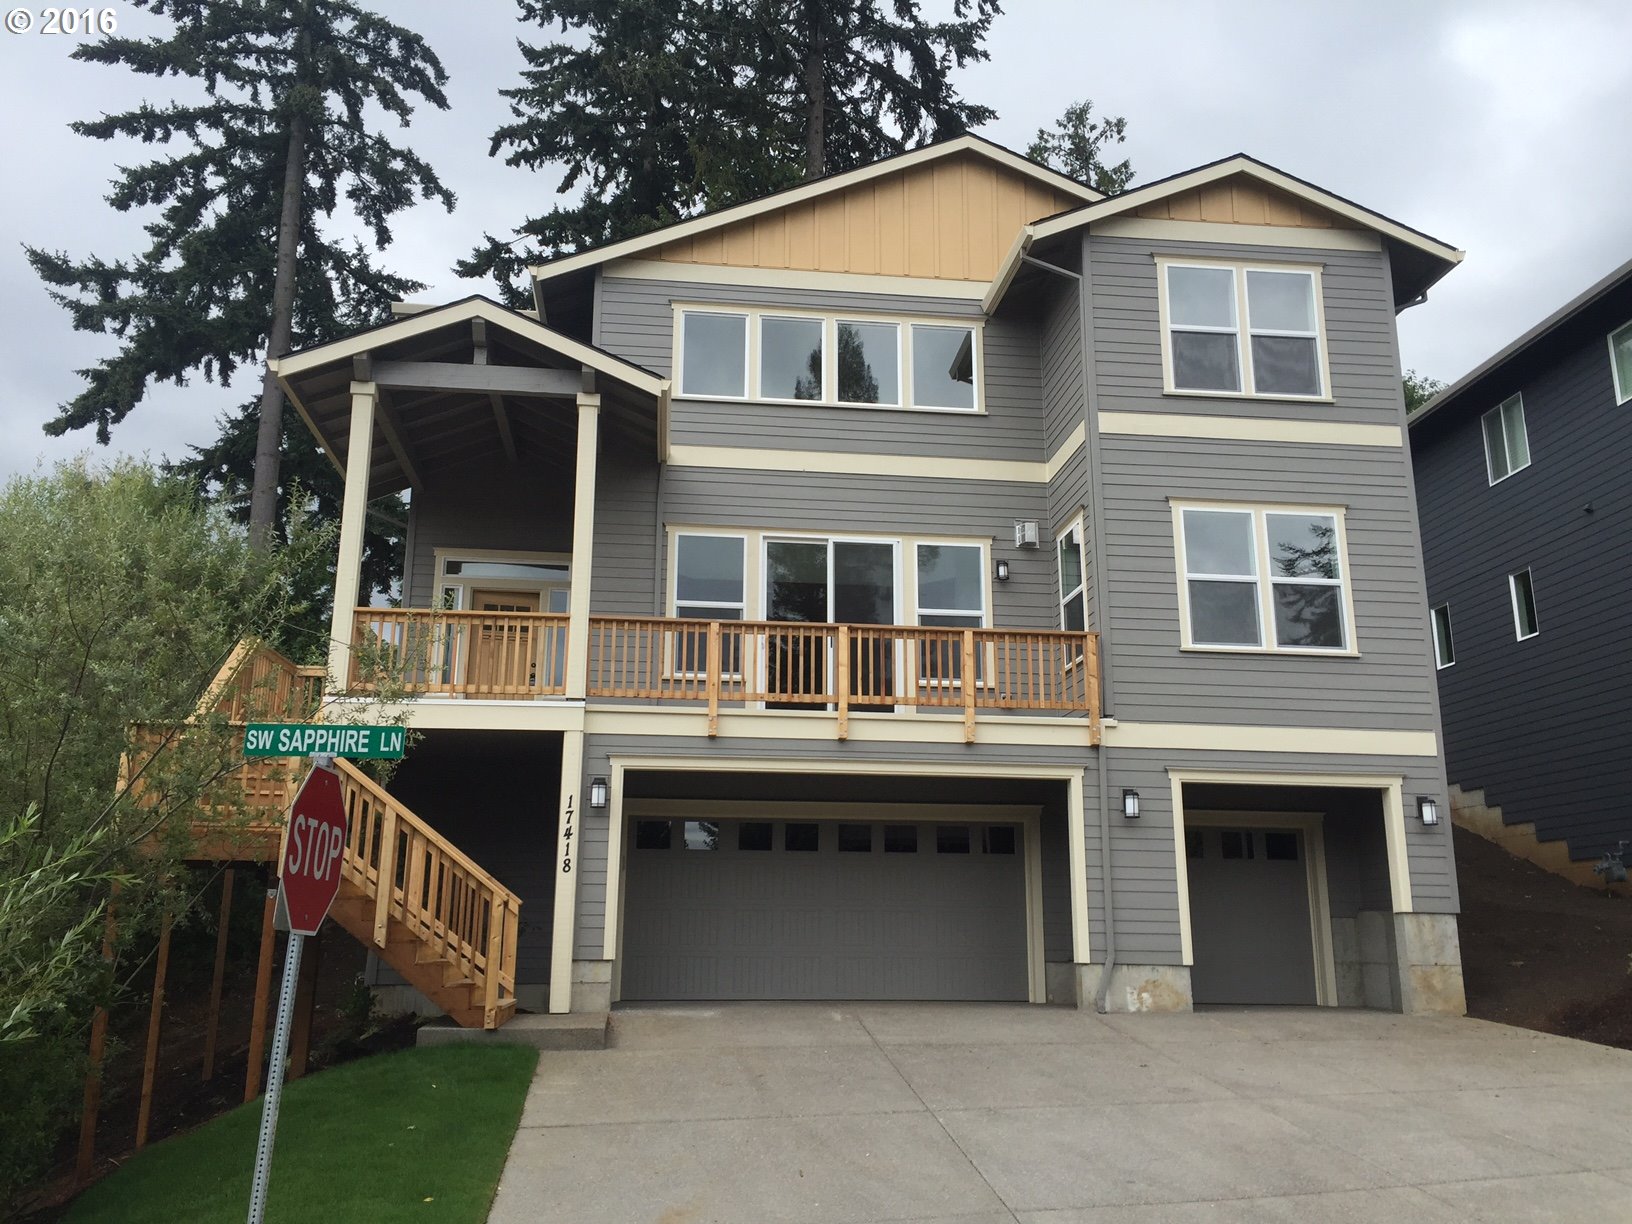
17418 Sw Sapphire Ln Beaverton, OR 97007
16140 Sw Granite Ct Beaverton, OR 97007
18450 Sw Kelly View Loop Aloha, OR 97007
15505 Nw Melody Ln Beaverton, OR 97006
9180 Sw Parkview Loop Beaverton, OR 97008
14755 Sw Bonnie Brae St Beaverton, OR 97007
8485 Sw Secretariet Ter Beaverton, OR 97008
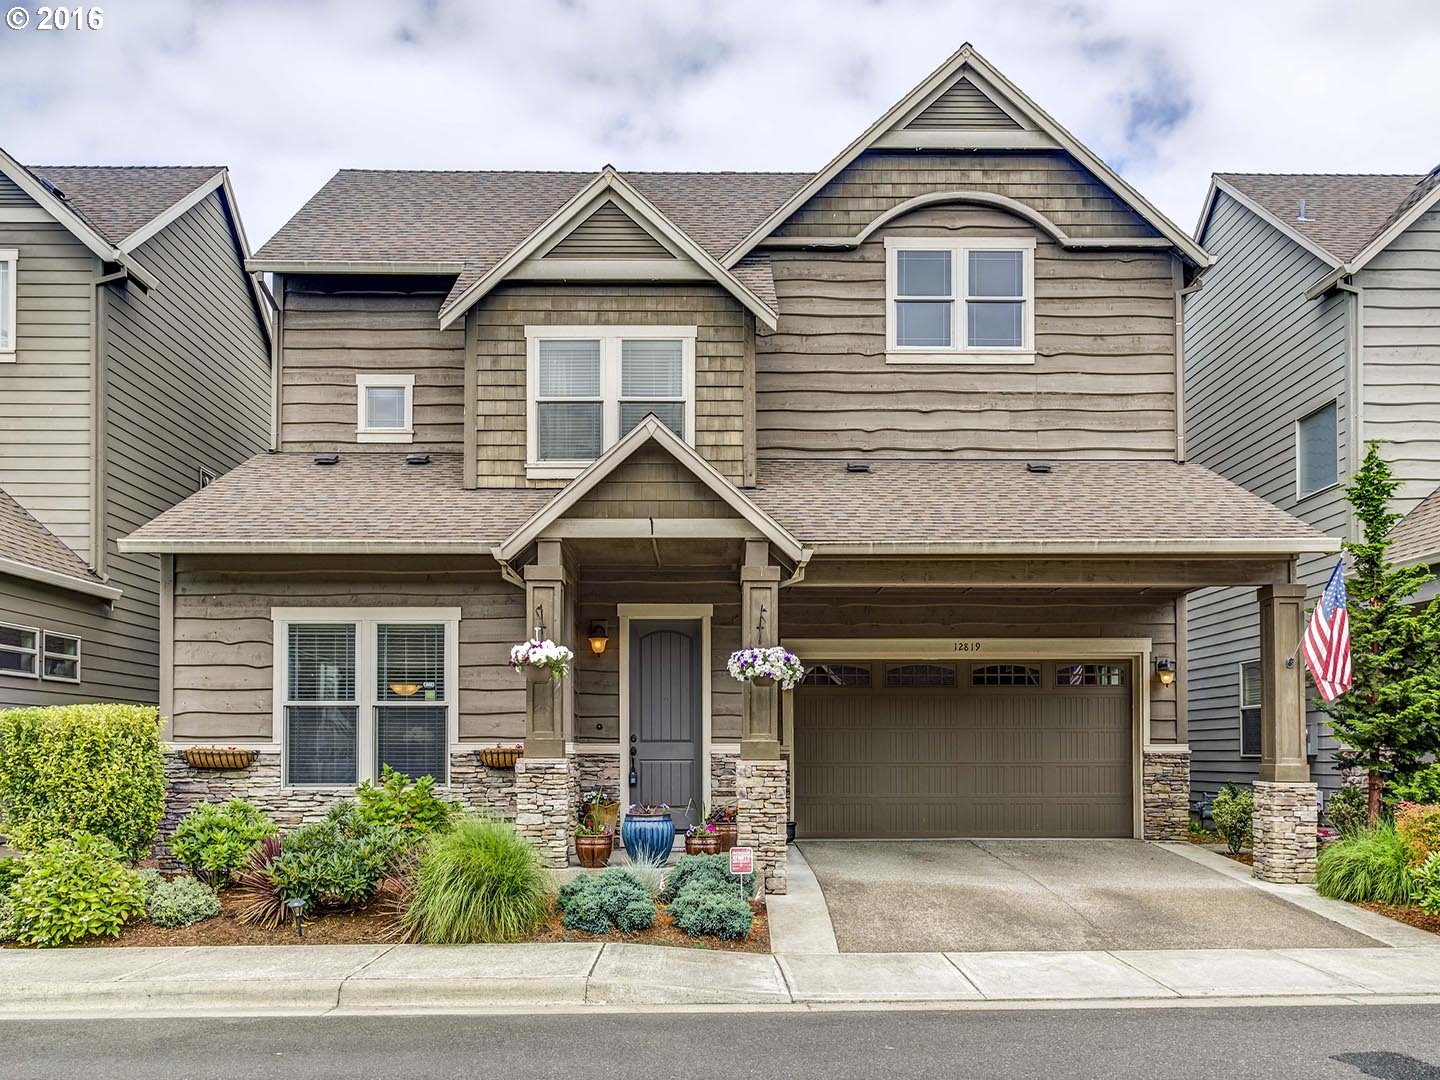
12819 Sw Killpack Ln Beaverton, OR 97005
18261 Sw Fallatin Loop Aloha, OR 97007
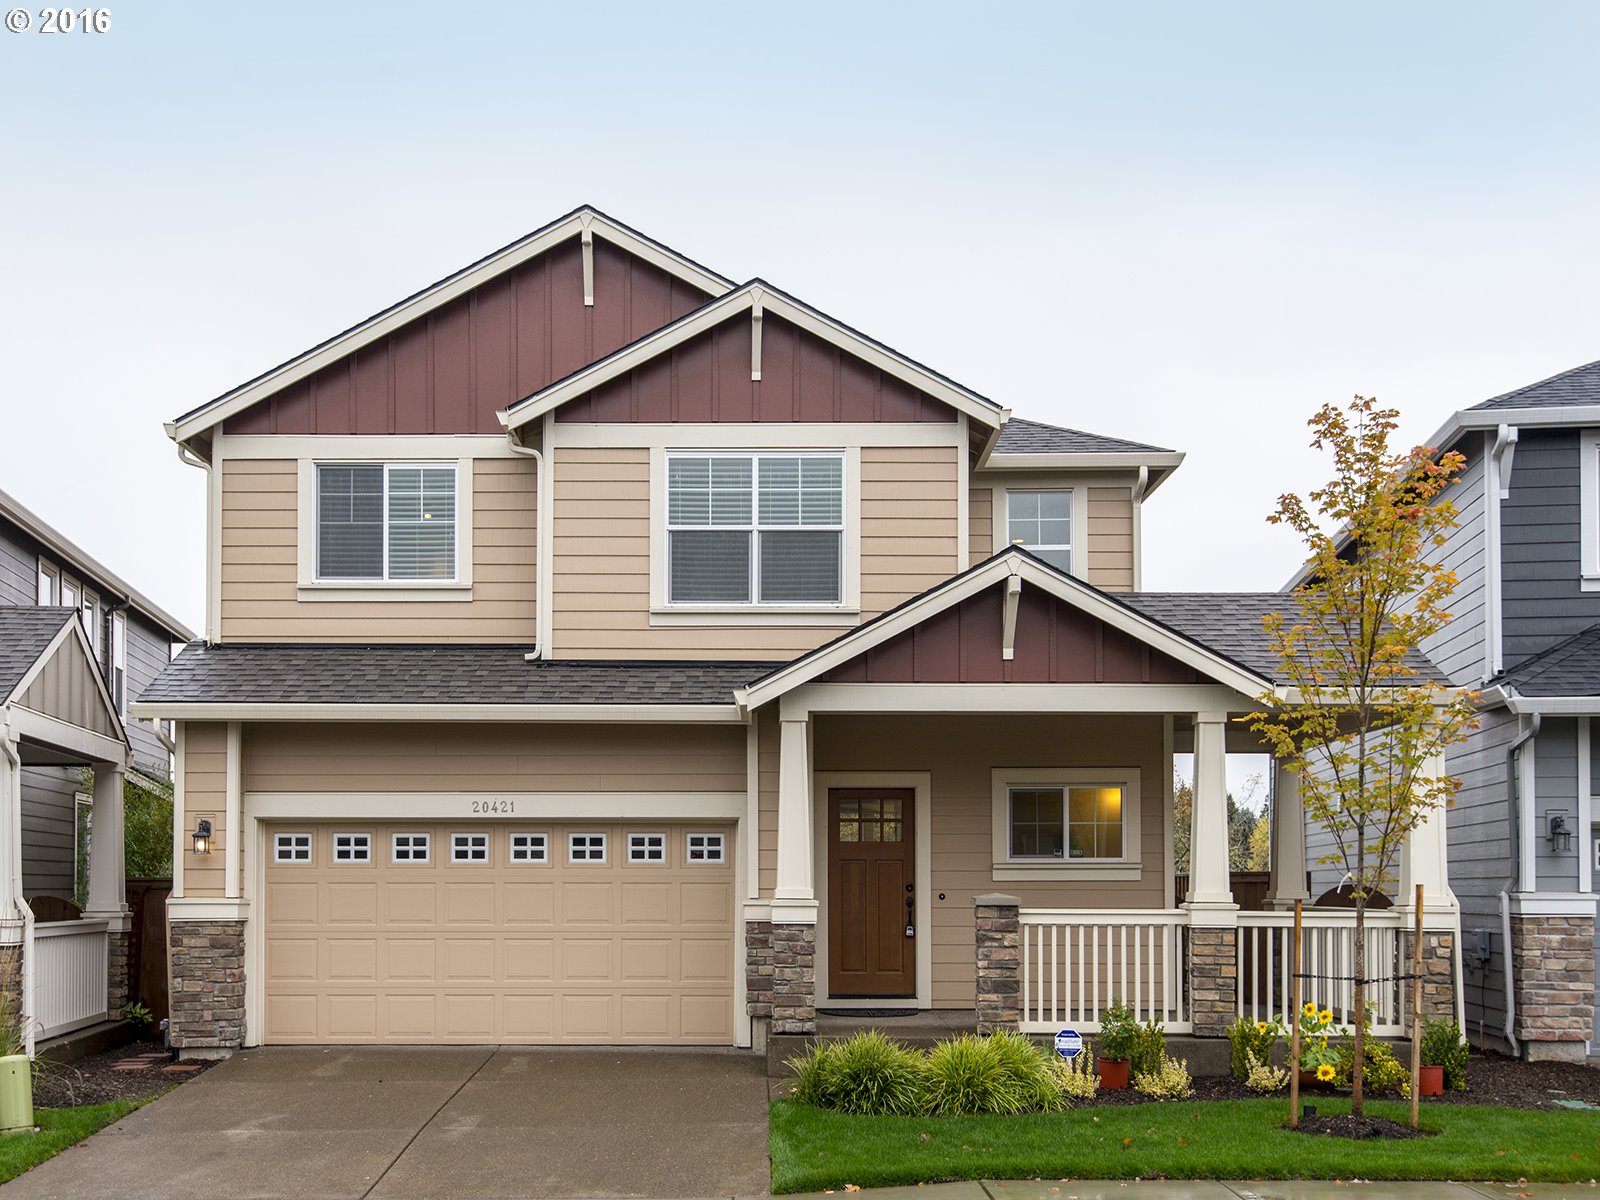
20421 Sw Gracie St Beaverton, OR 97006
6525 Sw Dale Ave Beaverton, OR 97008

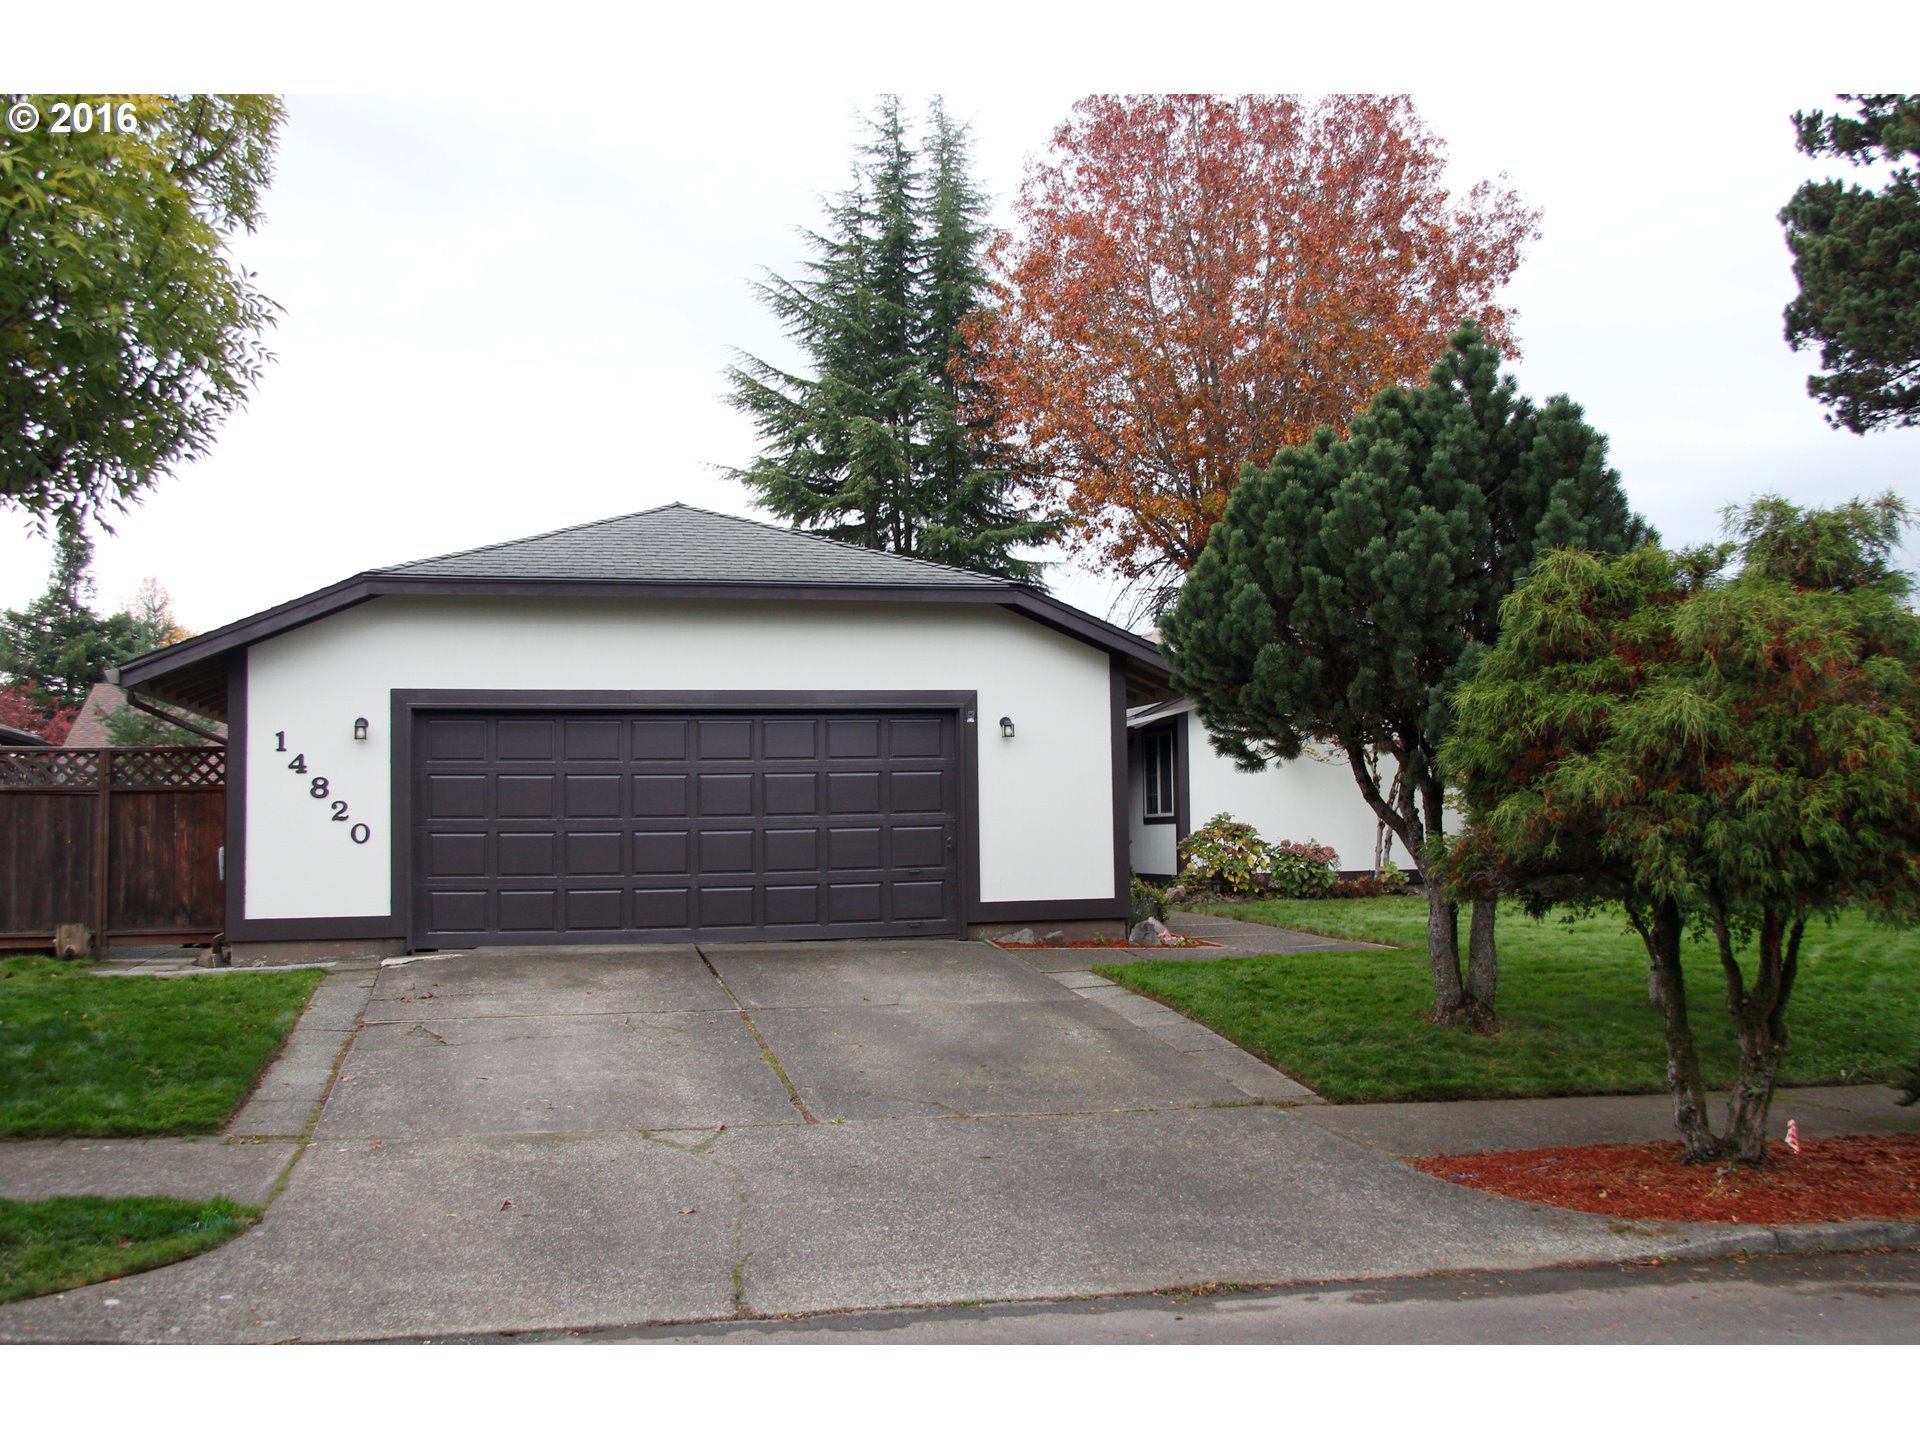
14820 Nw Ridgetop Ct Beaverton, OR 97006
17525 Sw Kimmel Ct Beaverton, OR 97007
11735 Sw Denfield St Beaverton, OR 97005
11760 Sw Jody St Beaverton, OR 97005
14935 Sw Village Ln Beaverton, OR 97007

13365 Sw Lancewood St Beaverton, OR 97008
220 Sw 172nd Ave Beaverton, OR 97006
15740 Sw Talus Ct Beaverton, OR 97007
7450 Sw 140th Ave Beaverton, OR 97008
450 Sw Frenwood Way Beaverton, OR 97005
17529 Sw Loma Vista St Beaverton, OR 97007
19334 Sw Larkcrest Ln Aloha, OR 97003
7392 Sw Crisp Dr Aloha, OR 97007
9120 Sw Graphite Ter Beaverton, OR 97007
7567 Sw 205th Ter Beaverton, OR 97007
19580 Sw Gassner Rd Beaverton, OR 97007
9015 Sw Ivory St Beaverton, OR 97007
16408 Sw Timberland Dr Beaverton, OR 97007
16980 Sw Ferrelo Pl Beaverton, OR 97007
15702 Sw Snowy Owl Ln Beaverton, OR 97007
9970 Sw Cynthia St Beaverton, OR 97008
8086 Sw 186th Ave Beaverton, OR 97007
1842 Sw Willowview Ter Beaverton, OR 97003
875 Se Tamango (lot 24) St, Hillsboro

7714 Sw Carrollon Dr Beaverton, OR 97007
21804 Sw Parkin Ln Beaverton, OR 97003
6615 Sw Juniper Ter Beaverton, OR 97008
3442 Nw Ashland Dr Beaverton, OR 97006
1700 Sw 208th Ave Beaverton, OR 97003
15155 Sw Opal Dr Beaverton, OR 97007

16898 Nw Paisley Dr Beaverton, OR 97006
8165 Sw Sorrento Rd Beaverton, OR 97008
15714 Sw Snowy Owl Ln Beaverton, OR 97007
14320 Sw Hart Rd Beaverton, OR 97008
2121 Nw 163rd Ter Beaverton, OR 97006
2113 Nw 163rd Ter Beaverton, OR 97006
20901 Sw Moline Ct Aloha, OR 97006
6355 Sw Wilson Ave Beaverton, OR 97008
4069 Sw Dalton Pl Beaverton, OR 97078

7280 Sw 170th Ave Beaverton, OR 97007
8855 Sw Pacer Dr Beaverton, OR 97008
5790 Sw Elm Ave Beaverton, OR 97005
17907 Sw Meadowbrook Way Beaverton, OR 97078
2105 Nw 163rd Ter Beaverton, OR 97006
3045 Nw 160th Ct Beaverton, OR 97006
18860 Sw Westland Ln Aloha, OR 97003

14816 Nw Yellowstone Ct Beaverton, OR 97006
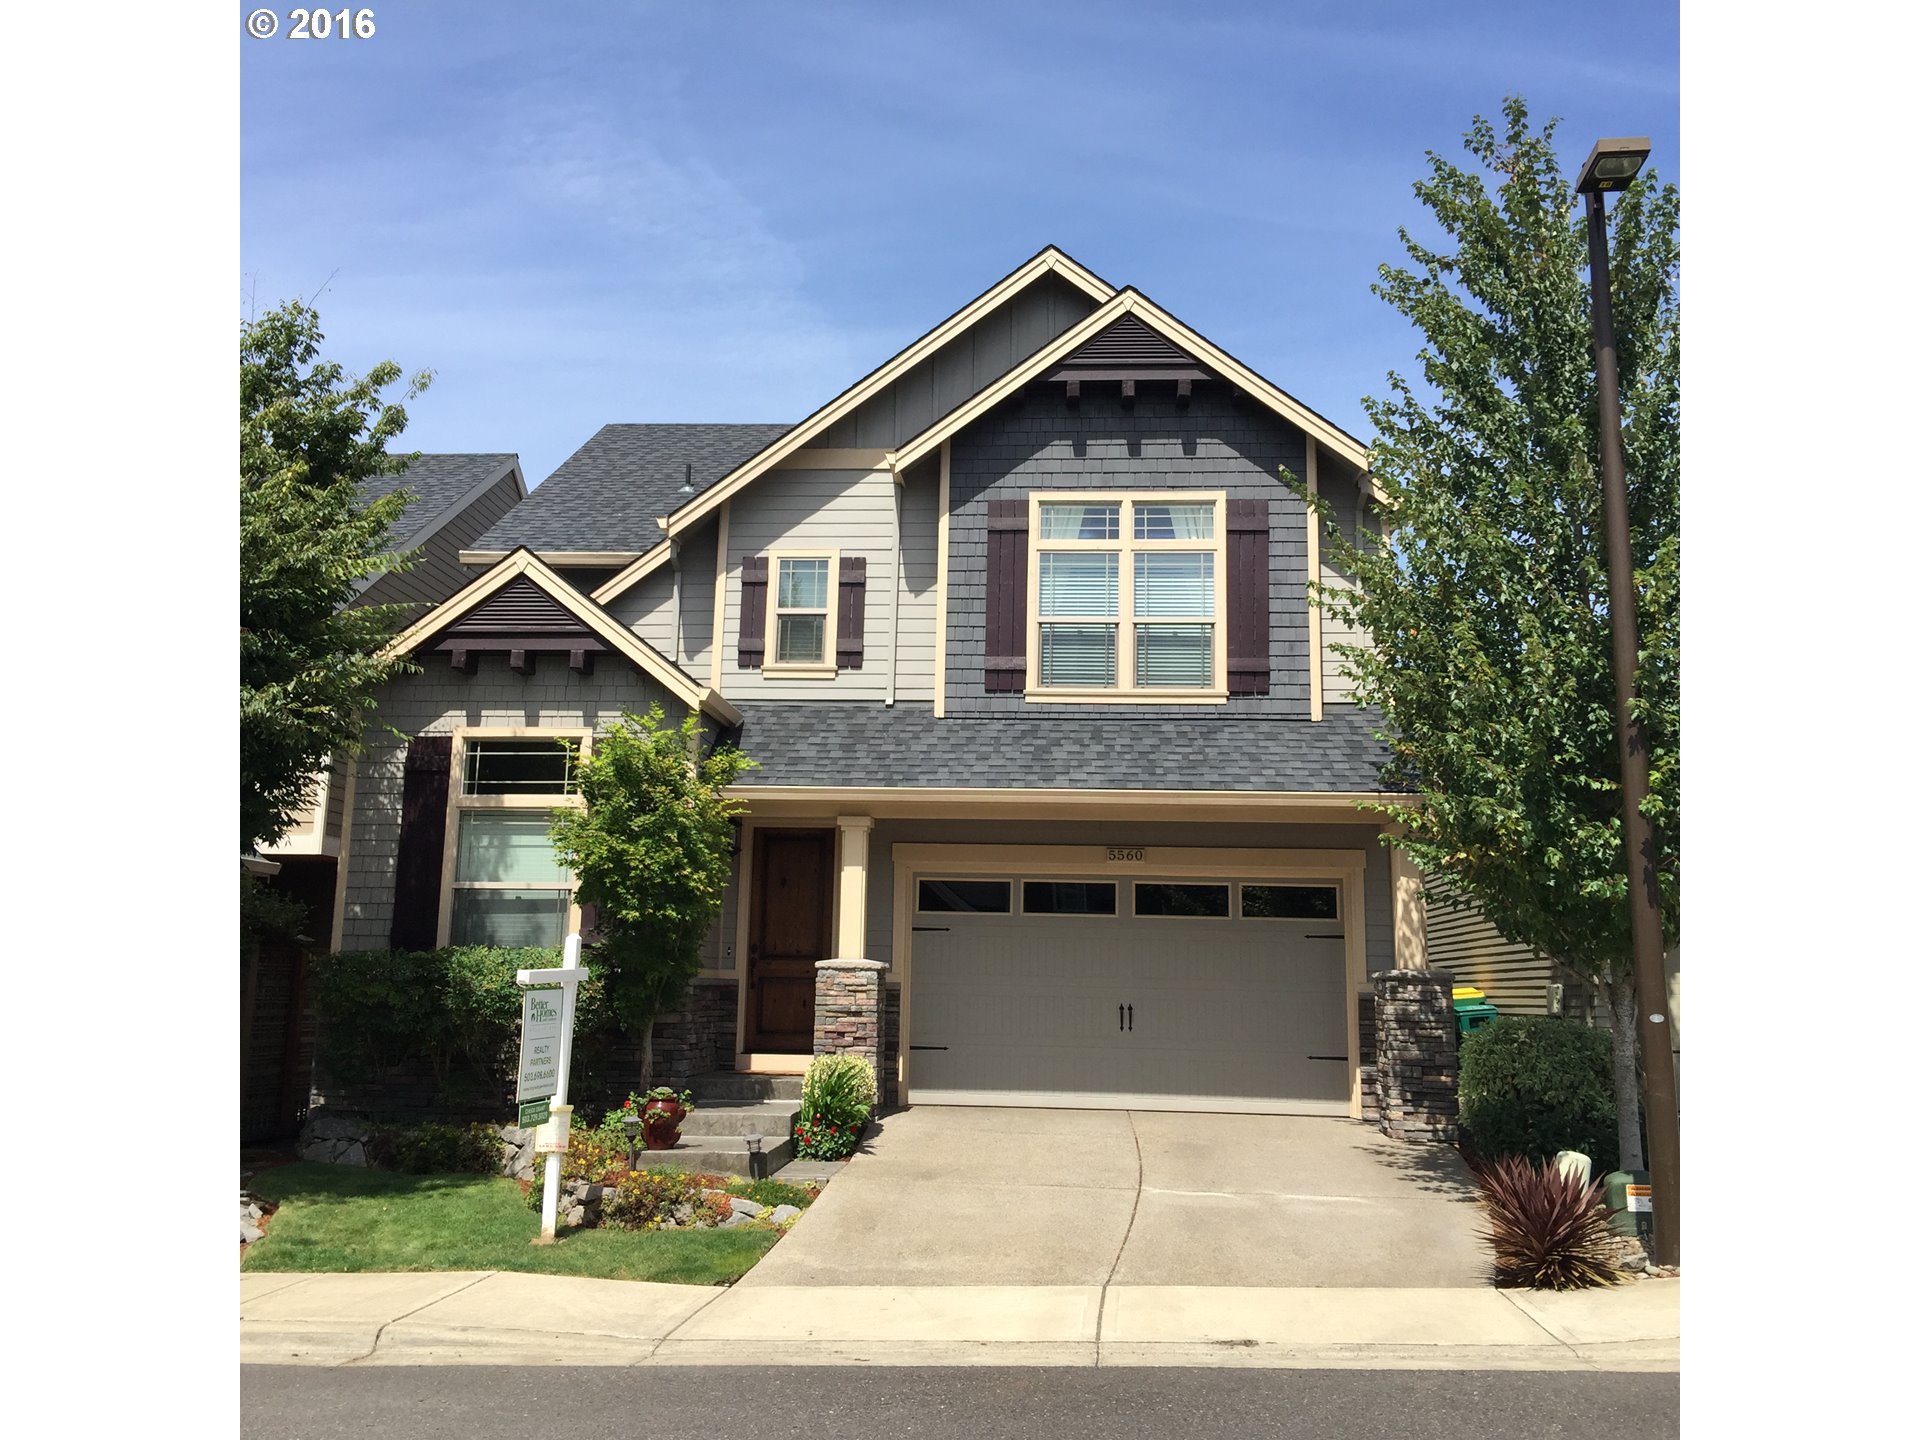
5560 Sw Norris Ter Beaverton, OR 97007
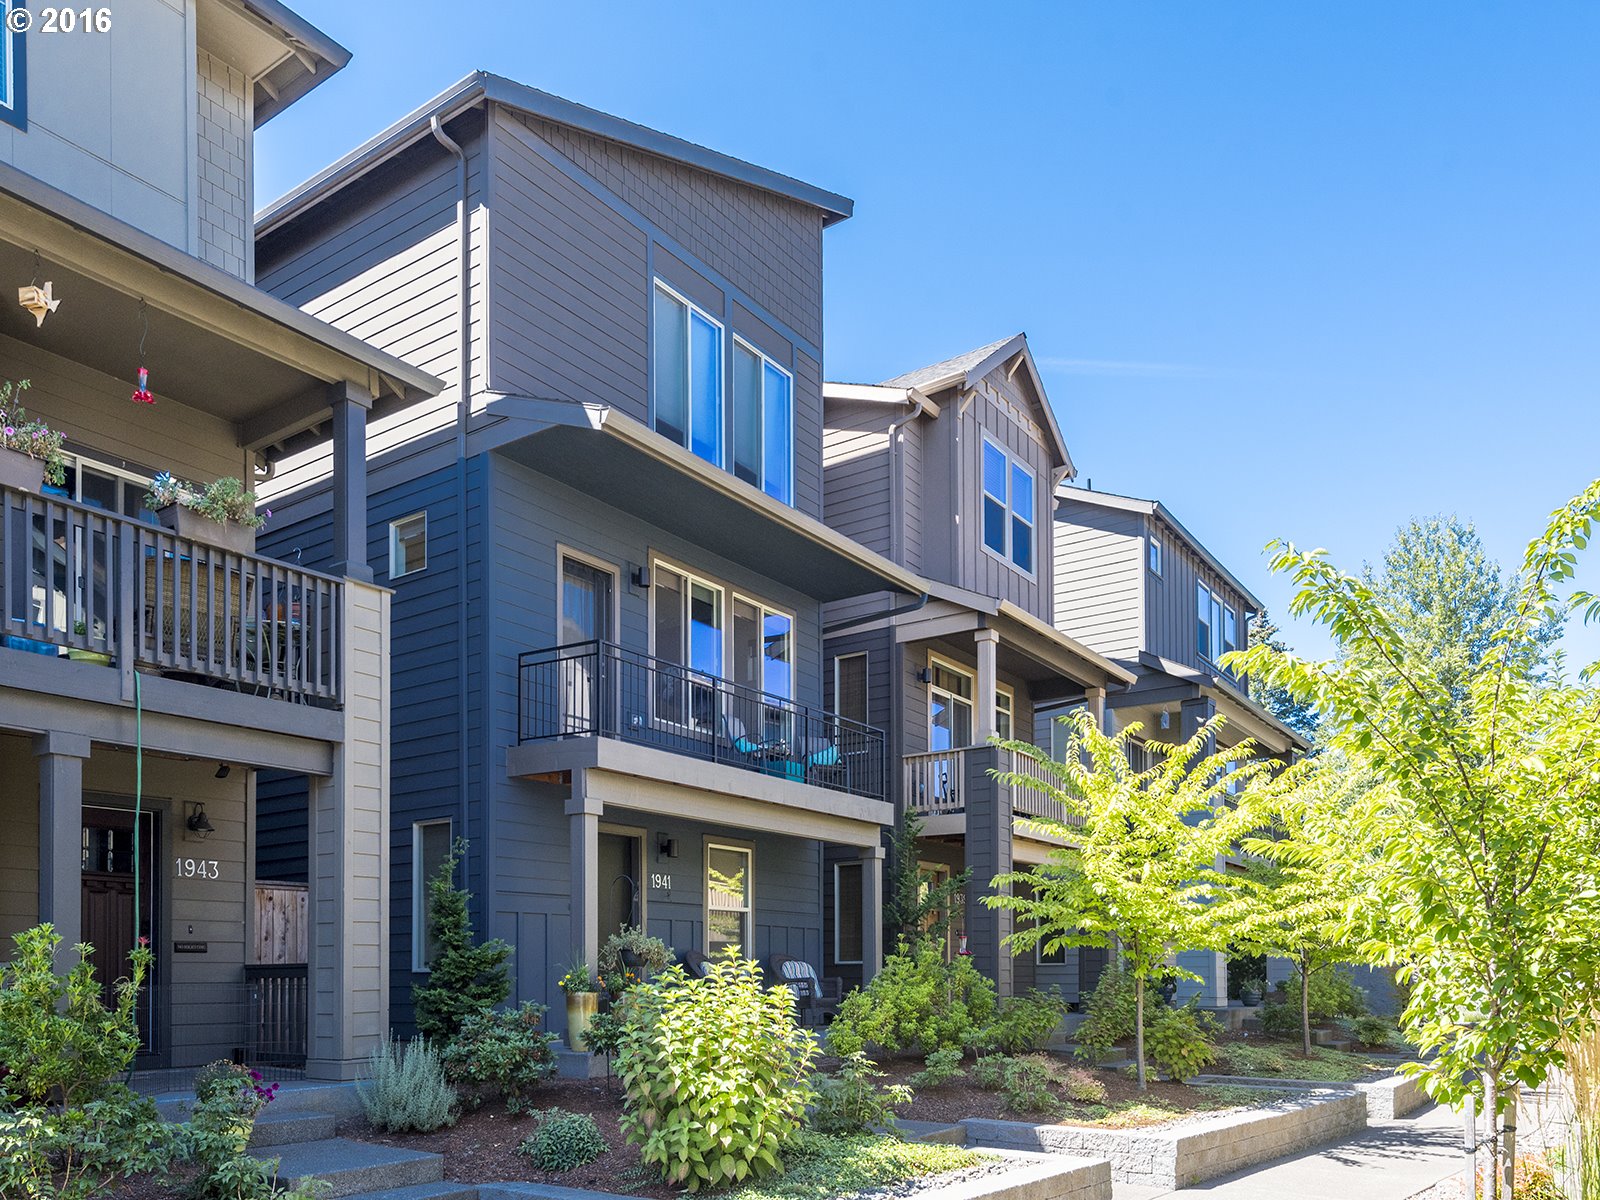
1941 Sw 144th Ave Beaverton, OR 97005
8190 Sw 165th Ave Beaverton, OR 97007
4089 Sw 174th Ave Beaverton, OR 97007
7035 Sw Juniper Ter Beaverton, OR 97008

7564 Sw Applegate Dr Beaverton, OR 97007
17225 Nw Madras Ct Beaverton, OR 97003
7359 Sw Linette Way Beaverton, OR 97007

857 Se Tamango (lot 23) St, Hillsboro
2525 Sw 204th Ave Aloha, OR 97003
1925 Sw 144th Ave Beaverton, OR 97005
899 Se Tamango (lot 25) St, Hillsboro

17569 Sw Kimmel Ct Beaverton, OR 97007
15790 Sw Misty Ct Beaverton, OR 97007
7521 Sw Applegate Dr Beaverton, OR 97007
674 Nw Pebblestone Ln Beaverton, OR 97006
9890 Sw 151st Ave Beaverton, OR 97007

15955 Sw Division St Beaverton, OR 97007
17842 Sw Meadowbrook Way Beaverton, OR 97078

17883 Sw Meadowbrook Way Beaverton, OR 97078

17923 Sw Meadowbrook Way Beaverton, OR 97078
17850 Sw Meadowbrook Way Beaverton, OR 97078

17891 Sw Meadowbrook Way Beaverton, OR 97078

17939 Sw Meadowbrook Way Beaverton, OR 97078
17955 Sw Meadowbrook Way Beaverton, OR 97078

17990 Sw Frances St Beaverton, OR 97003
3789 Nw 163rd Ter Beaverton, OR 97006
3107 Sw 197th Ave Beaverton, OR 97003
7372 Sw 196th Pl Beaverton, OR 97007
6800 Sw Hyland Way Beaverton, OR 97008
6995 Sw Rollingwood Dr Beaverton, OR 97008

7002 Sw 156th Ave Beaverton, OR 97007
11575 Sw Welch Ct Beaverton, OR 97008
15764 Sw Jaylee St Beaverton, OR 97007
15015 Sw Kingbird Dr Beaverton, OR 97007

5030 Sw 206th Pl Beaverton, OR 97078
7360 Sw 163rd Pl Beaverton, OR 97007
19556 Sw Treehouse Ln Beaverton, OR 97078
6780 Sw Taurus Pl Beaverton, OR 97007
18255 Sw Kinnaman Rd Aloha, OR 97078

16510 Sw Wright St Beaverton, OR 97007
7310 Sw 104th Ave Beaverton, OR 97008
4365 Sw Scottie Pl Beaverton, OR 97078
10265 Sw Crestwood Ct Beaverton, OR 97008

1173 Nw Weybridge Way Beaverton, OR 97006

256 Sw Meadow Dr Beaverton, OR 97006
5500 Sw 172nd Ave Aloha, OR 97007
4125 Sw 185th Ave Aloha, OR 97078
7155 Sw 189th Ave Beaverton, OR 97007
20360 Sw Carlin Blvd Beaverton, OR 97078
20419 Sw Premier Ct Beaverton, OR 97003

More About Beaverton
- Location Eight miles west of downtown Portland. You approach Beaverton from the east on the Sunset Highway (US-26). It is the first suburb you reach driving west out of downtown Portland.
- Origin of Name Beaverton received its name because of the existence nearby of a large body of beaver dam land. The soil of this character was sought for by pioneer settlers because of its productivity.
- Neighborhood Associations The City has 11 neighborhood associations.
- Topography Mainly flat areas plus some gently rolling hills.
- 2Drive Time to Downtown About 20 minutes from the center of Beaverton.
- Public Transportation Beaverton has three rail transit lines and 21 bus routes. Westside MAX (light rail) was built through mostly undeveloped areas in Beaverton and Hillsboro. Even before the line opened, many new residential and retail projects sprang up along the line, especially in the mid-Washington County section. TriMet operates numerous routes in and out of Beaverton. Transit Score provides a 0-100 rating indicating how well an address is served by public transportation. Ratings range from “Rider’s Paradises” to areas with limited or no nearby public transportation.
- 3Census 2010 Demographics Population – 89,803. Area size – 18.73 square miles. Population density: 4,795.1 per square mile. Number of households – 39,500. Median household income of $55,786 (metro area median household was $49,260). Diversity – 27% non-Caucasian. The median value of owner-occupied housing units – $304,300. Percent of residents over 25 years of age holding a bachelor’s degree or higher 42.4%. See City Data for more information about Beaverton.
- 4Crime Stats There were 1,471 property crimes (assault, arson, burglary, larceny, robbery, theft from auto, vehicle theft) in 2013. There were 139 violent crimes (aggravated assault, homicide, robbery, rape) committed in 2013. There were 18 crimes per 1,000 residents in 2013. The latest crime stats (by neighborhood) are available at the Beaverton Police Department website.
- Sex Offenders Click here for the State of Oregon Sex Offender Inquiry System. After agreeing to the “Conditions of Use Statement,” you will be redirected to an “Enter Search Criteria” page. Insert a zip code in the “Zip” field and click on the “Query” button.
- 5Shopping and Services Number of supermarkets: 13. Number of health clubs: 18. Public libraries: The City of Beaverton has one library located at 12375 SW 5th Street. You’ll drive to shop and eat out − you can find an outlet or mall a few blocks from any home in Beaverton.
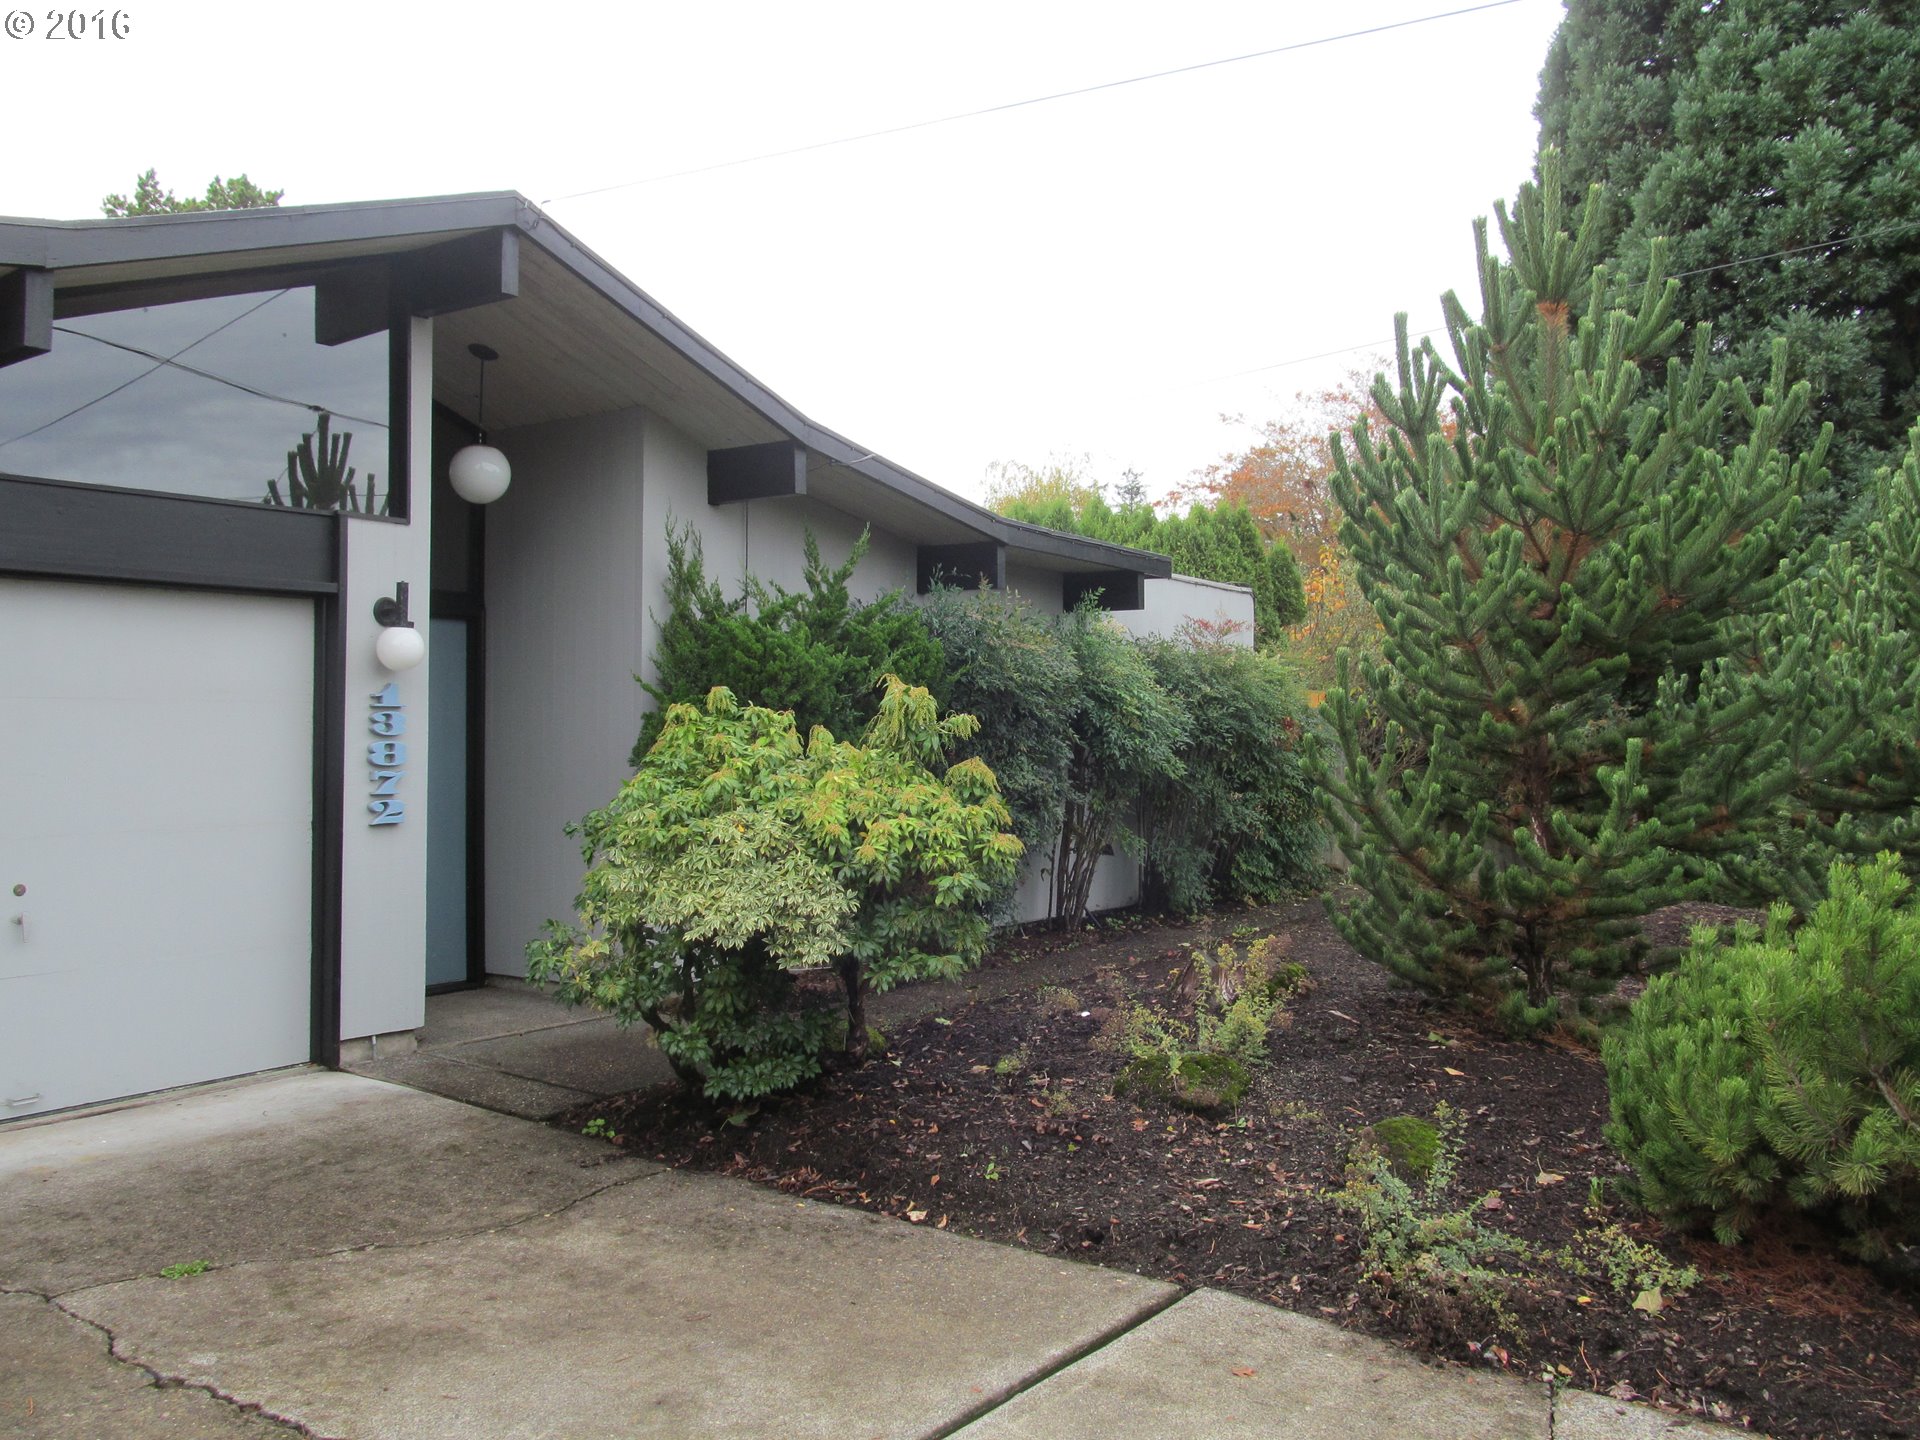
- Housing Types and Styles Today most residents live in new developments in a variety of housing types to include condos and townhomes. For example, 28.5% of the housing units (total of 32,507) have ten or more units in the building.
- Renters vs. Home Owners 2010 Census: owner occupied 51.4% and number of housing units 39,500. The median value of owner-occupied homes was $304,300.
- Who Lives in Beaverton The demographics of Beaverton covers such a range that one can safely say that just about every kind of human lives in Beaverton. A surprising statistic is that 18.4 percent of the residents are “foreign born” according to City Data. The 2010 Census reported that 42.4% of the residents 25 and older hold a bachelor’s degree or higher. Beaverton has numerous engineers that work at Intel as well as a large population of agricultural workers that work in the vineyards, fruit orchards, and nurseries in the county.
- They Probably Drive You can find at least one of everything made. You have Volvo neighborhoods as well as “pickups and gun racks” areas.
- Biking Beaverton has 95 miles of bike lanes. Bicycle Trip Planner will map a route for you and − just provide a starting point address and your destination address.
- Schools Many of the Beaverton schools is among the best in the state. Westview High School had nine National Merit Scholars, and there were three more in other Beaverton high schools in Oregon’s 27 newly minted scholars in 2013. Click here to visit the Beaverton Schools website.
- List of Schools in Beaverton Click here to view a list of all the public and private schools in Beaverton — demographics, location map, enrollment, and ethnicity can be viewed for each of the 60 plus schools.
- School Locator Find your school attendance area or a school site and view the boundary area using School Locator.
- 6School Report Cards Click here for report card details on Beaverton schools. Select “Beaverton SD 48J” to view individual schools within the district.
Map of the City of Beaverton
______________________________________