
Oregon Property Taxes |

The property tax in Oregon is used for the support of local taxing districts such as public schools, cities, and counties. Oregon’s property tax system is one of the most important sources of revenue for the public sector in Oregon as this source raised nearly $4.5 billion for local governments in fiscal year 2007-08. Property subject to taxation includes all privately owned real property (e.g., land, buildings, and fixed machinery and equipment), manufactured homes, and personal property used in a business. There is no property tax on household furnishings; personal belongings and automobiles; crops; orchards; business inventories; or certain intangible property such as stocks, bonds, or bank accounts. Most property used for religious, fraternal, and governmental purposes is exempt. Reductions in assessments are granted for certain types of property such as open space, farmland, forestland, and historical buildings. Properties owned by disabled veterans also are given reduced assessments. The rate of taxation on property is governed by the needs of the taxing districts within the constitutional and statutory limits. For example, the cities in Multnomah County (i.e, Portland) receive about 39 cents of each property tax dollar to pay for police, fire, parks, and other services. Public schools, community colleges, and special districts, such as Metro and TriMet, receive 37 cents from each property tax dollar collected. The county gets the rest which is 24 cents. The Multnomah County Tax Assessor administers property taxes for the City of Portland. The City Auditor does not collect assessments through property taxes and they do not collect property taxes. Visit these site for more information:
Suffering from insomnia? The cure is reading the Oregon Department of Revenue’s 124-page Board of Property Tax Appeals Manual. Sources of Information About Oregon Property Taxes
Terms
Property AssessmentThe process of identifying taxable property and assigning a value to it is termed appraisal. County assessors appraise most property in Oregon. The Oregon Department of Revenue appraises certain large industrial sites and utility property. Each county assessor prepares their county’s assessment roll, which is a listing of all taxable property as of January 1 of each year. Utility property is placed on a statewide assessment roll. The department allocates utility values to the county rolls prior to the preparation of tax bills. The county assessor is supposed to appraise properties at their market value. The total RMV of property in Oregon was $501.1 billion in 2008. Detached single-family properties have two components, land and the actual building. Your tax bill will show both values along with the (MAV). TrendingThe RMV of real property is estimated by a recent sale of the property or by an appraisal of the property conducted by the county assessor, or the Oregon Department of Revenue in the case of certain industrial or centrally assessed property. The appraisal method used depends upon the nature of the property. Residential property and bare land are most often appraised by comparing sales of similar property. Income-producing or commercial property may be valued by more complicated appraisal techniques. Between reappraisals of property, the RMV of real property may be adjusted each year based upon sales ratio studies conducted by the assessor to reflect increases or decreases in the value of different classes of property. This is called “trending.” New HomesNew homes (built after 1998), including new lots, are assessed by multiplying the current RMV times a percentage. For example, in 2008, the ratio applied to new residential property in Multnomah County was 50.46% of RMV. The percentage is calculated annually for each class of property and it represents the average ratio of all properties MAV to RMV. The intent is to provide similar tax savings for new property that is applied to existing property. In 2007 the percentage was 51.59 and in 2006 the percentage was 56.97. In 2004, the percentage was 62.42. Note the declining percentage over the years. This was due to the biggest boom years in real estate values in the Portland metro area. The RMV of properties in Oregon increased 15.4% from 2006-07 to 2007-08. The highest average price (as well as median price) was in the summer of 2007. As of the summer of 2009, values have decreased approximately 20 percent from the summer of 2007 based on sales of property as reported by the Regional Market Listing Service (RMLS). If properties are adjusted to reflect the declining values of properties in the metro area, the percentage should start increasing in 2009. Tax Rates
tax levy amount / taxable assessed value = tax rate $225,000 / $39,487,000 = .0056980 or = $5.6980 per $1,000 of assessed value This tax rate is placed on the individual property tax accounts in the city. All the taxable property within the city will have the same rate for the local option tax. The amount of tax to be paid, of course, will vary depending on the assessed value of each property. Individual properties are taxed by the districts that provide services to that property. For example, a property in Green City would pay taxes to the city, the county, a school district, and maybe a library district. Property outside the city would pay taxes to the county, a school district, a rural fire protection district, and maybe a library district, but not to the city. Some properties are subject to assessments of a special taxing district. An example would be a drainage district that assesses on a per acre basis. These qualifying assessments also are placed on the tax roll. The total amount of tax placed on a property is computed by multiplying the property’s assessed value by the combined tax rates of all the districts in which it is located and then adding any assessments. Taxable Value LimitationsOver the years, Oregonians have approved three measures that affect property taxes. Measure 50 has had the most impact on the ways property taxes are collected in the state. Below is a brief summary of each measure:
Taxable Value Limitation: Measure 50The Oregon Constitution limits the rate of growth of property value subject to taxation. The limit is based on a property’s Maximum Assessed Value (MAV). The MAV was established for all property in existence in 1997-98 by a formula described in the constitutional amendment, Measure 50. MAV for new property is computed using a different formula also contained in the constitution. MAV is allowed to increase each year by no more than three (3) percent. There are exceptions to this limit, however. The addition of a new structure, major improvement of an existing structure, and subdivision or partition of the property are examples of exceptions that would increase MAV by more than 3 percent. Each year the MAV and RMV for each property are figured. The property is then taxed on the lesser value, which is called the Taxable Assessed Value (TAV). The below chart shows the Average Assessed Value and Real Market Value in Multnomah County where Portland is located. As the market value of homes since the summer of 2007 have been declining, the chart shows that the spread is beginning to narrow between the two values (note that market values are calculated as of January 1, based on sales in the previous year. Drops in value in 2009, for example, won’t be reflected in the tax statements until October 2010). In 2009 the difference was 50% and in 2010 the spread was 60%. The assessed value in 2010 was $174,390 and the market value was $288,725. You can see the it will take a drastic decrease in RMV before the two values equal. Should that ever occur it will mean that property taxes have to decrease.
Tax Limitation (Compression): Measure 5 LimitsThe Oregon Constitution also sets limits on the amount of property taxes that can be collected from each property tax account. These limits are often called the “Measure 5 limits.” To figure these limits, taxes are divided into categories described in the constitution. The categories are: education, general government, and non-limited, which is usually general obligation bonds. The limits are $5 per $1,000 of RMV for education taxes and $10 per $1,000 of RMV for general government taxes. RMV is defined by law as the lowest amount a property would sell for during the assessment year. Measure 47This 1996 measure pegged a home’s assessed value back to the level in 1995, cut that value by ten percent, then capped its growth at three percent a year. This measure did not call for a reassessment when a home sold. Neither did Measure 50. This was also a measure that amended the state constitution. Multnomah County Auditor’s Map Compare TaxesHave you ever wondered how your property tax bill compares to your fellow Multnomah County homeowners? A tool from the Multnomah County Auditor’s Office lets you find out. You can use the map to see how your neighborhood stacks up against the rest of the county. You can also plug your street into the search bar to find out how your tax bill would change if Oregon stopped using Measure 50’s formula. SummaryBelow is a step-by-step summary of how the Oregon property tax system works. We have ignored Measures 5 and 47 to make it easier to understand.
Visit Portland Maps to view a property’s tax. Just insert a Portland address and the first page will give both the Market Value and the Assessed Value of the property. Clicking on “Assessor” will provide the details of the property tax. Net Result of the Above MeasuresThe net result is that Portland, along with the rest of the state, remains suspended in the 1995 time period when it comes to property taxes. This means that neighborhoods and areas within Portland have many disparities for homes of equal value. Overall, outer east and some areas of outer Southwest Portland have the highest taxes in the city. Relatively low taxes are scattered in pockets throughout the city but mostly come in North and inner Northeast, where the 1996 reassessment fell by the wayside with the adoption of Measure 50. The Oregonian published the below figures in early September 2005. They will help you determine taxable values (i.e., assessed values) compared with estimated market values by Zip Code:
Looking at the Zip Codes above, the highest percentages of assessed value to market value are in newer communities. For example, in Zip Code 97229 is the Forest Heights neighborhood in Northwest Portland where most of the homes have been built within the last ten years. The same situation exists for Zip Code 97230 which is located in Parkrose, an outer eastside neighborhood. The Oregon property tax system penalizes new home owners as they pay more property taxes than do homeowners who live in older homes of comparable values. The High Tax and Low Tax NeighborhoodsMultnomah County divides its property-tax map into neighborhood districts. For low residential property taxes, records show the best neighborhood for cheap property taxes is No. 163 in inner Northeast Portland—a rectangle bordered by Northeast Killingsworth Street, North Williams Street, Northeast Fremont Street and I-5. On average, homes there are assessed at 24 percent of their real market value, the lowest rate in the county. The neighborhoods in this area are Piedmont, Woodlawn, Humboldt, King, and Boise. The highest residential property taxes are in No. 83, an L-shaped neighborhood in Northeast Portland bordering 148th Avenue, Halsey Street, 160th Avenue and the Banfield Expressway. On average, homes there are assessed at 70 percent of their real market value due to their relatively slow appreciation since 1995. Should you desire to test the above, go to the Search for a Home for Sale by Neighborhood tool and find a home in the Woodlawn (low tax area) neighborhood and a home in the Wilkes (high tax area) neighborhood − both should be approximately the same price. The taxes will be displayed on the listings. Or go to Portland Maps and insert the address of each to find the property tax for each property. Note the market value and assessed value of each − to be accurate, the market values of both properties should be approximately the same assuming each seller is asking a realistic price for their property. The assessed values of each property most likely will show a wide disparity and thus the property tax will also. Other InequitiesAnother inequity occurs when a home sells for significantly more than the RMV that the appraiser has placed on the property. Taxes are often not reassessed when a home sells for significantly more than the RMV. For example, a home sells for between $500,000 – 600,000 but have a tax assessed value of just $350,000. Therefore, the taxes are calculated on the $350,000 amount. What makes it unfair is that a house across the street may have a much lower market value but will pay approximately the same property tax. Library Gets Its Share Now Thanks to Measure 5, a certain percentage of properties in Oregon have a limit on how much they can be taxed. Because of that limit, certain taxes take priority over others. Permanent levies — those going to the city, county and Port of Portland, for example — get their take first. If there is still money left to pay out before the cap, then it gets directed to local option levies. For example before the 2012 election some properties don’t pay anything to the libraries because they were tapped out before the library system could get its share. In 2012 the Multnomah County Library decided they wanted a permanent levy like the Port of Portland so they asked the voters to created a library district and the measure passed by a wide margin. The library will now be able to grab its slice of the tax pie at the same time as the other permanent levies, essentially chipping away at what certain properties pay out to the county and the city. According to city economist Josh Harwood’s report, which bases its numbers on figures from the county, that’ll mean the city collects about $9.5 million less in property taxes. That reduction, in turn, means about a $7 million reduction in the city’s general fund for the 2013-14 budget period. The city’s budget isn’t the only area that would see cuts, however. The Portland Children’s Levy, which goes toward a number of services for the city’s children, would also see a $1 million reduction. Solutions Proposed to Adjust For Inequities Because subjects such as property tax compression just aren’t confusing enough, Oregonians will have to bone up on a concept known as reset at sale. Lawmakers will take up reset legislation in 2013 on behalf of the League of Oregon Cities. The result would increase the fairness of Oregon’s tax system, which is a good thing, and also the money it generates, which may not be. Aa explained above, each property in Oregon has both a real market value and an assessed value. The former is what the property presumably is worth, and the latter is a generally lower number used to calculate property taxes. On average, assessed property values statewide were 74 percent of real market values in the 2011-2012 tax year, according to the Legislative Revenue Office. Buried within that average are innumerable inequities. Even in the same city, houses with comparable real market values can have widely divergent assessed values — and, as a result, very different tax bills. See the last section on this page (The Broken System of Property Taxes) for specific examples of these inequities. Under the League of Oregon Cities’ proposal, which would reset a property’s assessed value to its real market value when the owner sells it. At that point, assessed value would, once again, escalate at 3 percent per year while real market value fluctuated along with the housing market. Boosting assessed value to real market value would swell the flow of money to local governments and schools. If assessed values were reset at sale, according to the Legislative Revenue Office, cumulative local tax revenue would jump by more than $92 million in the first year alone. Reset at sale would require a constitutional change, and therefore a statewide vote. And voters aren’t likely to support this. The Oregonian in a December 19, 2012 editorial proposed an alternative to the League’s.
A Broken System of Property Taxes in Oregon
How can this happen? Because assessed values are stuck in 1995, when one home was still a low-income neighborhood, the property was assessed at just $79,510. The other home in the Southwest Hills, where values were already high in the ’90s, was assessed at $291,910. Rates rise just 3 percent a year, even though the real value of the home in the low-income neighborhood grew far faster and is now equal to the Southwest Hills home. It started when voters in 1990 agreed to limit the amount of tax homeowners pay to $15 for every $1,000 their property was worth. The initiative—called Measure 5—sought to restrain government but allow taxes to grow with the economy, measured by the value of property. It was a sensible proposal and it had the added benefit of equalizing school funding for rich and poor districts. It passed with 53 percent of the vote. But tax activists weren’t satisfied with Measure 5, because a property’s value could still skyrocket. They argued you had to strap down the value of the home for tax purposes—in other words, limit the growth in what’s called the assessed value (see above explanation of MAV). So Measure 47 was put on the ballot and it passed. It didn’t change the tax rate. It just rolled back the assessed value of all property to their 1995 levels, minus 10 percent. And it reached into the future, saying assessed values of property can grow no more than three (3) percent a year. One year later, the Legislature tinkered with Measure 47 just enough to make the law workable, and its new version, Measure 50, passed in 1997. Ten years later, when Oregon was enjoying a booming real-estate market—and a property-tax system mangled by three measures, the system revealed it unfairness. All because Oregon’s base property values are forever frozen in 1995. Here is what the Willamette Week had to say about Oregon property tax system back in 2007:
|
 Each year in late September or early October, the county assessor places the taxes certified by the taxing districts on the tax roll. Property taxes are placed on the tax roll in the form of a rate per $1,000 of assessed value. In most cases, the taxes for operations are the permanent rate limits certified by the districts. When a district certifies a dollar amount tax levy, such as a local option tax or bond tax, the assessor must calculate a tax rate. To compute the tax rate, the tax levy amount is divided by the taxable assessed value of the district. For example: Green City certifies a local option tax in the amount of $225,000. The taxable assessed value of the city is $39,487,000. The rate for the local option tax is calculated as follows:
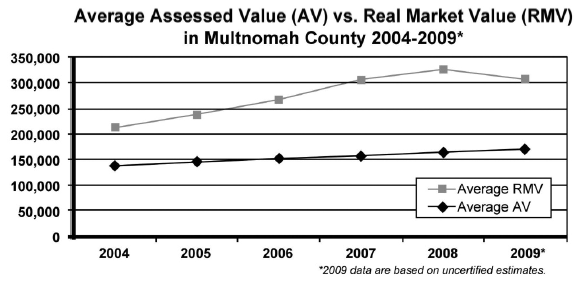
 In October of 2007 the
i
Contact Susan and Shelli
Susan — Principal Real Estate Broker, CRS, GRI | Direct (503) 497-2984
Shelli — Real Estate Broker | Direct (503) 497-5061
Office (503) 297-1033

6443 SW Beaverton-Hillsdale Highway, Suite 100
Portland, Oregon 97221
Copyright © 2015 Susan Marthens. All Rights Reserved.
